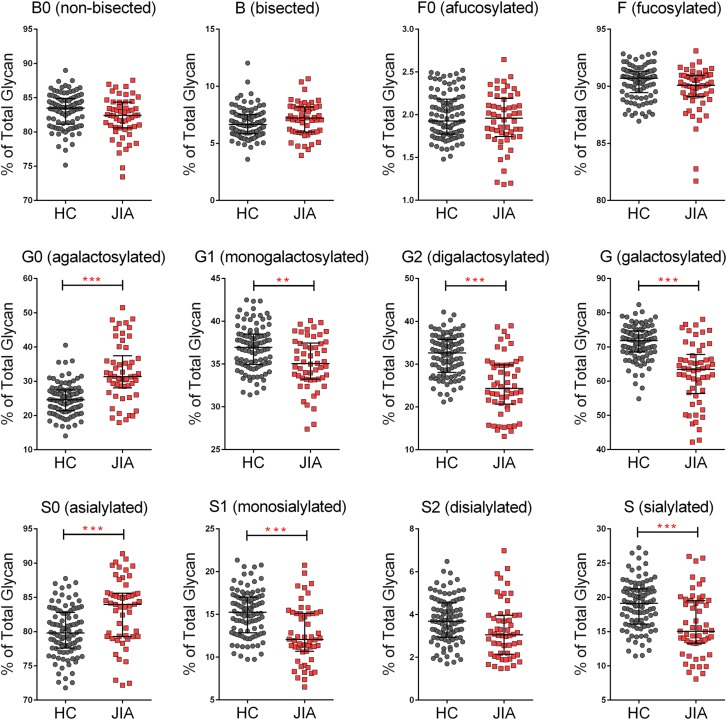
Fig. 2.
Comparison of derived glycan compositions in healthy controls and JIA subjects. Derived glycan compositions were calculated and compared between healthy control (HC) and JIA subjects (*P < 0.05, **P < 0.01, ***P < 0.001). This figure is available in black and white in print and in color at Glycobiology online.

