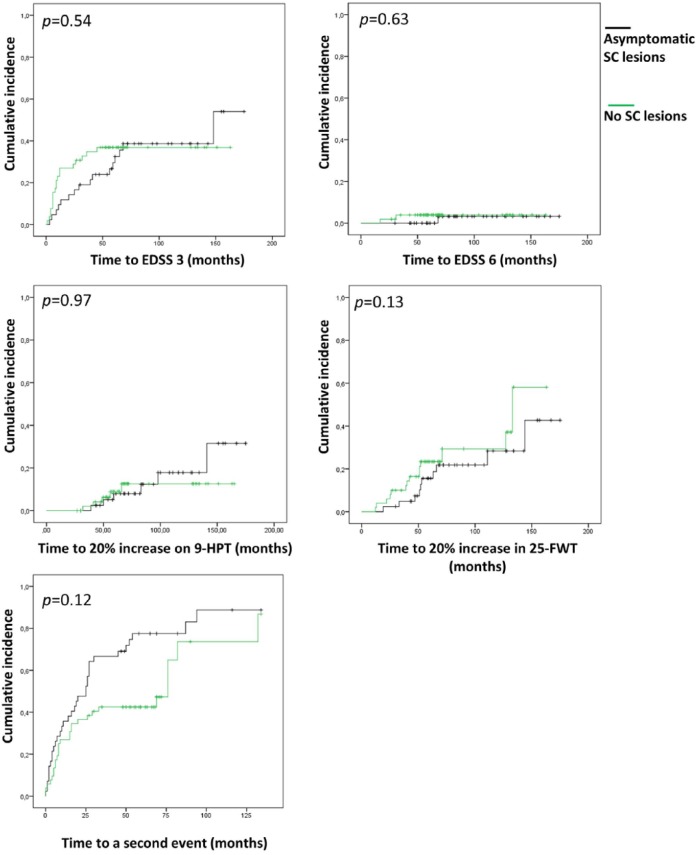
Figure 2.
Cumulative incidence curves for disability progression and second relapse. Showing the comparison between patients with asymptomatic SC lesions and the patients without SC lesions. Corrected p-values are given. Correction by Cox-regression analyses were performed to correct for diagnosis (CIS/RRMS) at baseline, disease duration at baseline, number of T2 brain lesions, start of DMT before reaching the endpoint and number of T1 gadolinium-enhancing lesions.
EDSS: Expanded Disability Status Scale; 9-HPT: 9-hole peg test; 25-FWT: 25-foot walking test.

