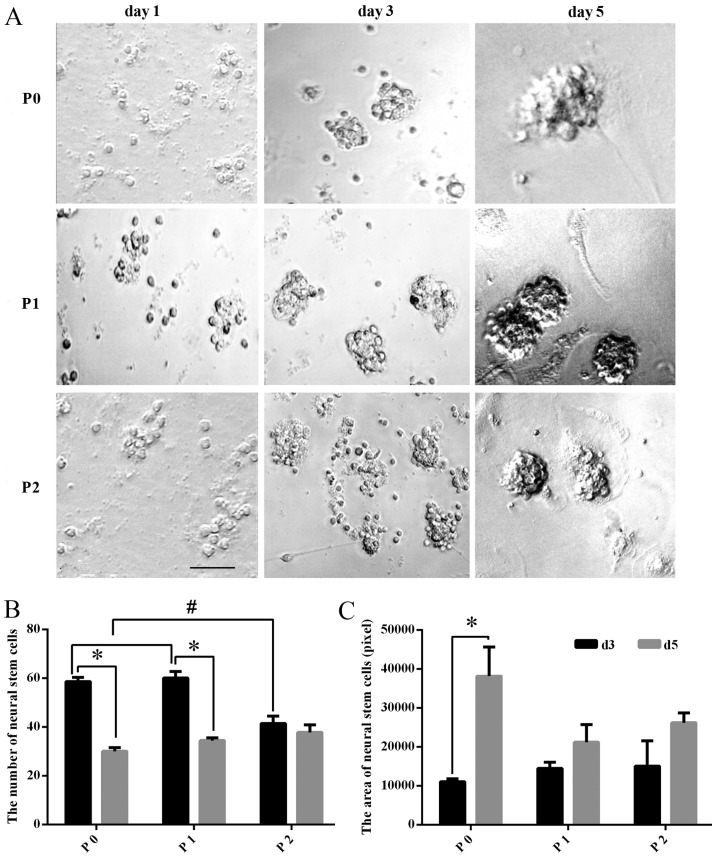
Figure 1.
Morphology of TS NSCs cultured in vitro. (A) TS NSCs were observed under a microscope without dye processing on days 1, 3 and 5 of primary culture (P0), and subculture (P1 and P2). Scale bar, 100 μm. (B and C) The number of NSCs in the different culture stages (P0, P1 and P2) was compared at different culture times (days 3 and 5). Data are presented as the mean ± SD (n=5). The area of NSCs in the different culture stages (P0, P1 and P2) was compared at different times (days 3 and 5). Data are presented as the mean ± SD (n=6). TS, tree shrew; NSC, neural stem cell; P, passage; d, day; SD, standard deviation.

