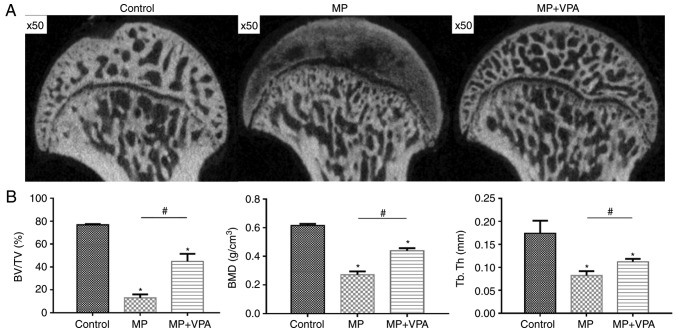
Figure 9.
Micro-computed tomography evaluation of the subchondral trabeculae of the femoral heads. (A) 2-dimensional images of the coronal section of the femoral heads in each group. (B) Morphometric analysis provided trabecular parameters of the whole region of the subchondral bone of the femoral heads (magnification, ×50). *P<0.05 vs. control group; #P<0.05 vs. MP group. VPA, valproic acid; MP, methylprednisolone; BMD, bone mineral density; BV/TV, bone volume per tissue volume; Tb.Th, trabecular thickness.

