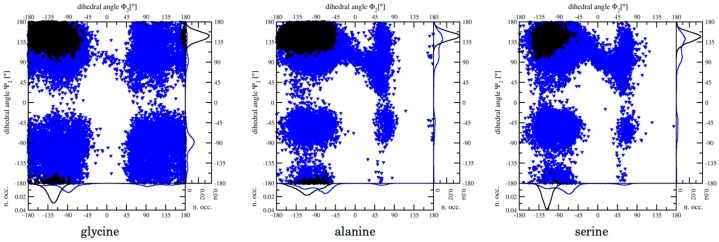
Figure 4.
Narrowing of sampled conformational space upon binding, monitored via central side chain dihedral angles. Blue triangles: free in solvent; black circles: complexed in OppA. Data was extracted from the longest available simulation of the end state at λ = 0, (i.e., the crystal structure before alchemical changes): All ϕ2/ψ2 side chain dihedral angles are monitored over 10 ns simulation time, except for KSK complexed in OppA (right panel, black circles), for which only 3 ns simulation time was available. Distributions are summed up for each angle in the flanking graphs on the right and below each Ramachandran plot, and the number of occurrences (n.occ.) was normalized.

