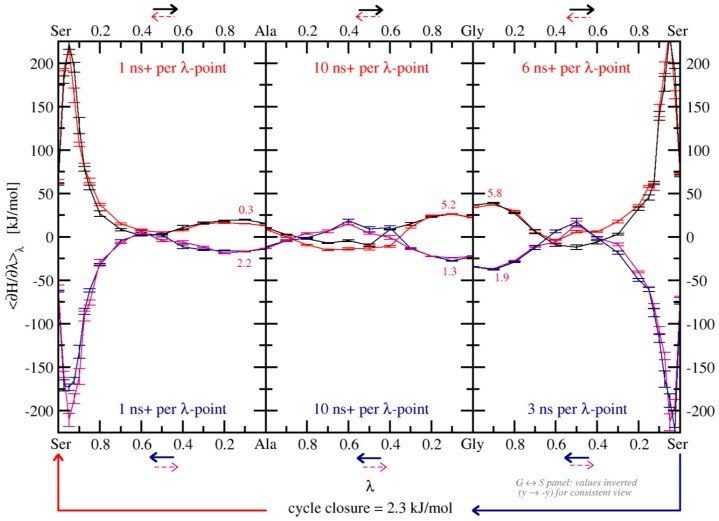
Figure 6.
Final thermodynamic cycle in OppA. Black and blue lines are forward transformations, red and purple lines are backward transformations (reading direction according to the arrows above resp. below each panel). Like in Figure 3, backward TI curves are shown with inverted sign and direction for better comparability to the forward process. The minimum trajectory length for all λ-points of a given panel is written in the respective color on the top and bottom of that panel. See Table S3 in the Supplementary Materials for individual prolongation times of diverging λ-points. Numbers directly above and below the lines are colored to refer to the hysteresis between associated forward and backward transformations and are given in kJ·mol−1.

