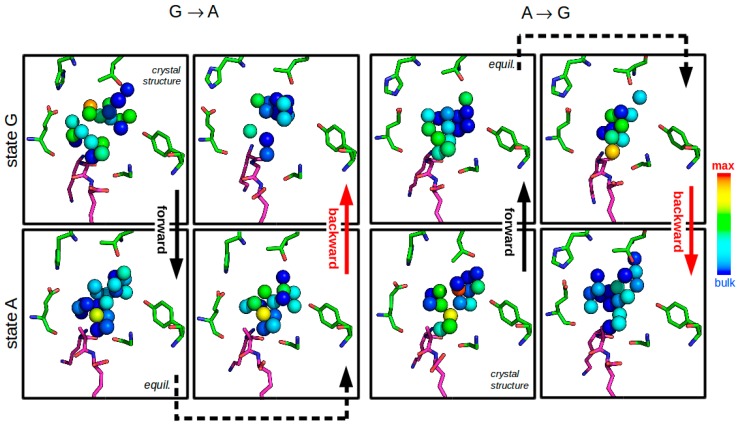
Figure 8.
Depiction of average water occurrences over the 10 ns end-point TI simulations of transformations between KGK and KAK. Protein and ligand atoms are depicted at their average positions after a superposition based on the backbone atoms. The average water occurrence frequency was monitored on a grid with a spacing of 0.2 nm. Water molecules are assigned to their nearest grid point. Grid points with at least 30% occupancy of the highest observed occupancy (corresponding to bulk water) are indicated in the figure and colored accordingly (red ~90%; green ~50%; dark blue ~30%). For clarity, some water locations close to the lysine-1 and lysine-3 side chains of the ligand have been removed. Panels in the same row represent identical system states. Note the lowered water densities when comparing the first and the last panel of each transformation run (upper left two for KGKcrystal → KGKfinal, lower right two for KAKcrystal → KAKfinal).

