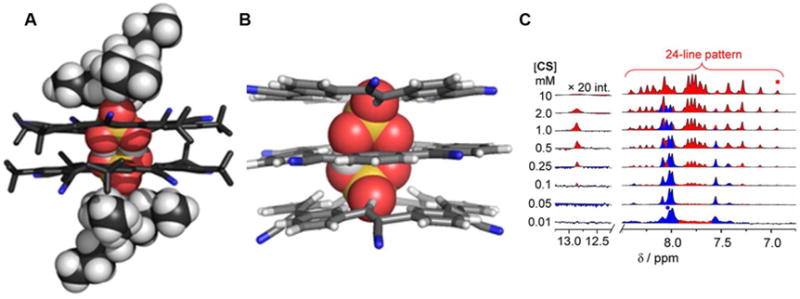
Figure 31. Illustrative structures of the complexes and variable concentration 1H NMR spectra.

(A) The crystal structure of the 2 : 2 : 2 complex (69 : HSO4− : TBA+).
(B) The energy minimized structure of the 3 : 2 complex (69 : HSO4−).
(C) The variable concentration 1H NMR spectra of 69 (60 : 40 v/v % CD2Cl2/CD3CN) as recorded in the presence of 1 equivalent of NBu4HSO4. Here CS refers to 69.
Taken from Fatila et al.97 and reproduced with permission. © 2017 Wiley-VCH Verlag GmbH & Co. KGaA.
