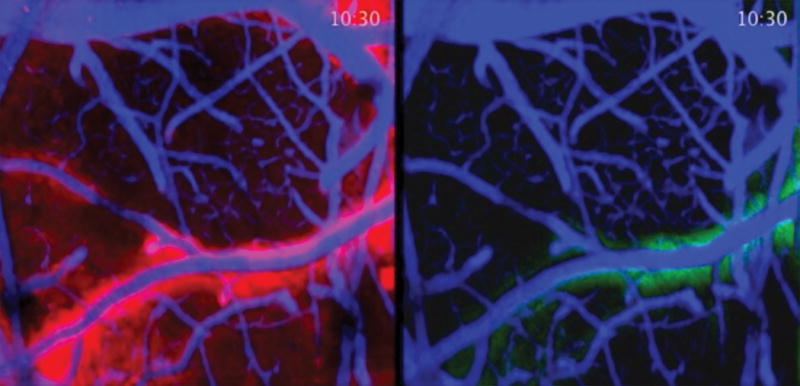
Figure 3. Cerebral spinal fluid influx in a murine model.

Difference of cerebral spinal fluid influx in the brain of a sleeping (left) and awake (right) mouse. Fluorescent dye was injected to enable the study of cerebral spinal fluid dynamics in a live mouse using 2-photon imaging. Red represents greater flow in a sleeping animal. Green indicates decreased flow in the awake animal. Images provided by Drs. Maiken Nedergaard and Lulu Xie of the Division of Glial Disease and Therapeutics, Center for Translational Medicine, Department of Neurosurgery, University of Rochester Medical Center. The work was funded by the National Institutes of Health/National Institute of Neurological Disorders and Stroke.
