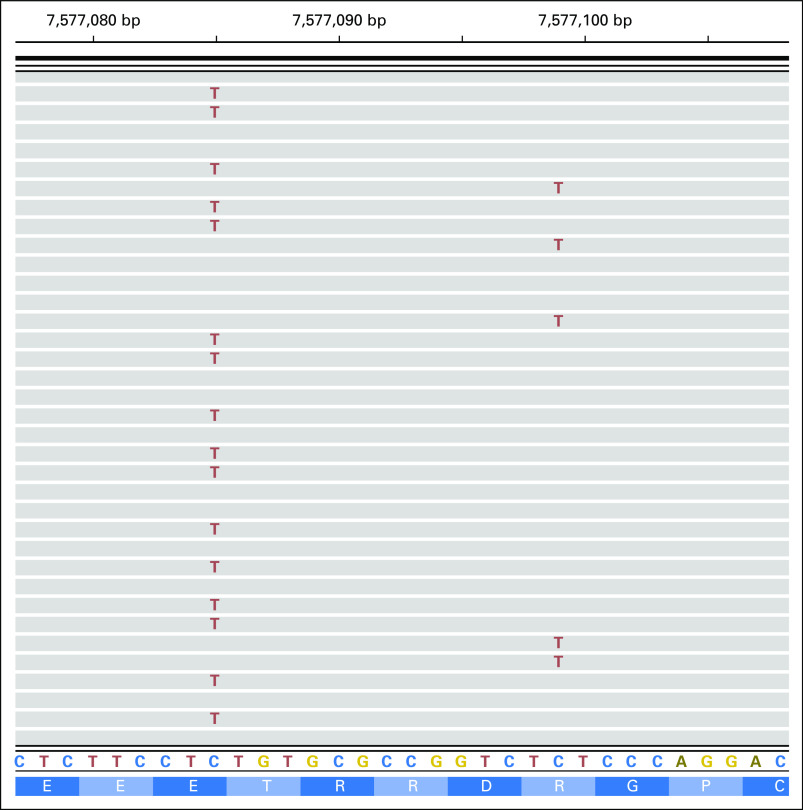
Fig A1.
Integrative genomics viewer screenshot of ES-2 bam file showing TP53 R280K (right; frequency, 0.04; identified in plasma) and E285K (left; frequency, 0.44; identified in both plasma and tissue) mutations. The screenshot illustrates the fact that the two mutations are mutually exclusive; that is, two distinct sets of reads carry these two mutations, supporting the possibility of convergent evolution of distinct subclones sampled in cfDNA.

