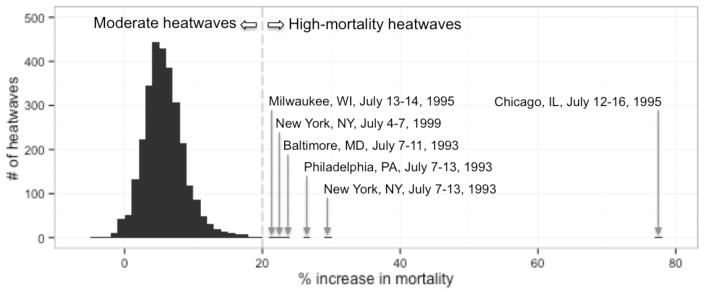
Figure 1. Distribution of the estimated heatwave effects (% increase in mortality), after hierarchical pooling, of all training set heatwaves (82 US communities, 1987–2005).
The vertical gray dotted line shows the division between moderate and high-mortality heatwaves, based on our definition (>20% increase in mortality for high-mortality).

