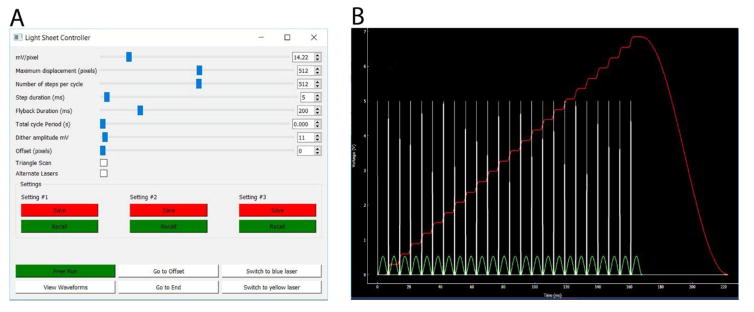
Fig. 2.
Microscope control software. (A) Dialog box of the light-sheet controller. From the top, the sliders control the step size of the piezo translator (which is set to match the pixel size of the camera); the maximum displacement of the piezo scan (in units of camera pixels); the number of steps per cycle; the duration of each step (which also sets the camera exposure time); the flyback duration; the total cycle period (used for timelapse imaging with intervals between scans); the amplitude of the signal applied to the dither galvanometer; and an offset of the starting scan position from the zero position of the piezo. As shown, the sliders are set to generate a volume image comprising 512 diagonal planes, each captured in 5 ms, giving a total time per volume of 2560 ms plus 200 ms for flyback. Checkboxes enable a fast bidirectional (triangle) scan mode to be activated that obviates the time otherwise required for flyback, an option to to switch laser excitation and emission filters between alternate volume scans. Buttons enable up to 3 sets of settings to be permanently stored and retrieved. (B) Window activated by the ‘View Waveforms’ button in the dialog box. This displays the waveforms (in V) generated to trigger camera acquisition (white spikes), the dither galvanometer signal (green sinusoid), and the piezo control signal (red stepped trace).

