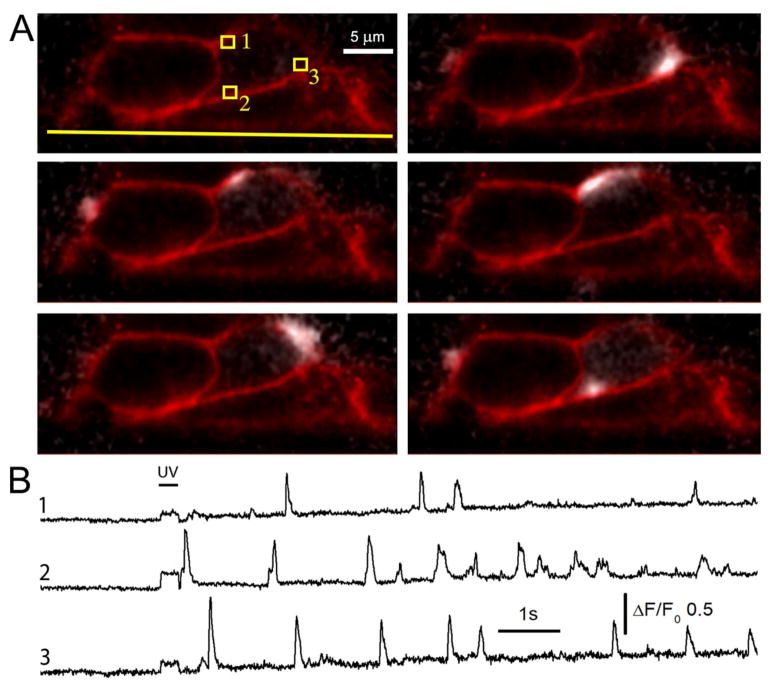
Fig. 4.
Single-slice imaging of near-membrane Ca2+ puffs. (A) Top left panel shows a diagonal cross section through a clump of SH-SY5Y cells imaging the plasma membrane with a deep red membrane marker, utilizing 562 nm excitation and a 590 nm long pass emission filter. This image was captured before imaging Ca2+ puffs with 473 nm excitation and 510–55 nm bandpass emission filter, and is superimposed on the following panels that show puffs (depicted in white) arising at different times following photorelease of iIP3. The yellow line in the top left panel indicates the location of the coverglass, and small squares mark regions of interest used to derive the fluorescence traces in B. (B) Traces show fluorescence ratio signals (ΔF/F0) measured from roughly 1 fl volumes (1 × 1 μm regions of interest) at numbered locations marked in A. The bar indicates the timing of the UV exposure used to photorelease i--IP3.

