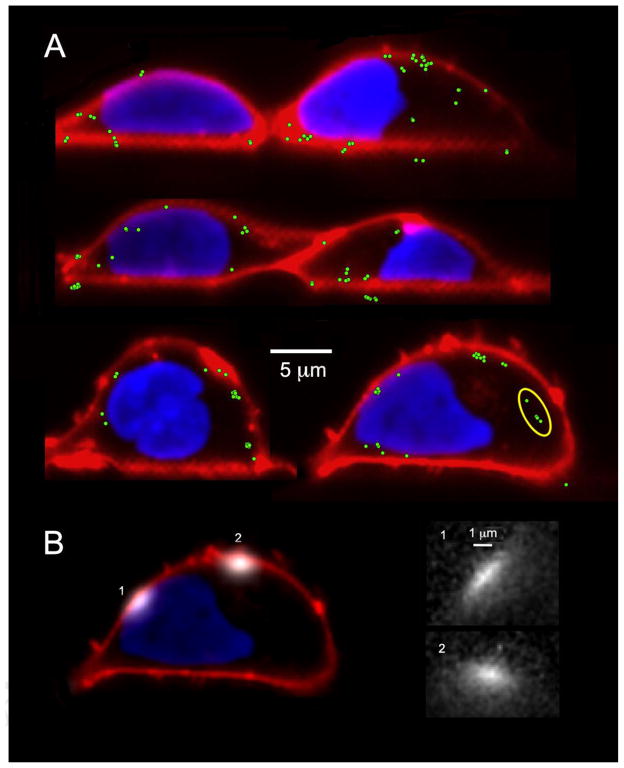
Fig. 5.
Localization of puffs with respect to the plasma membrane and nucleus. (A) Representative light-sheet sections of cells stained with Deep Red Membrane marker and Nuclear-ID Red to visualize the plasma membrane (depicted in red) and the nucleus (depicted blue). The green dots mark centroid locations of puff fluorescence signals evoked by photorelease of i-IP3. (B) The left panel shows superimposed images of two puffs (depicted in white), arising at different times following photorelease of i-IP3, at sites adjacent to (1) and distant from (2) the nucleus. The right panel shows enlarged views of these puffs, captured as single frames at the time of peak fluorescence.

