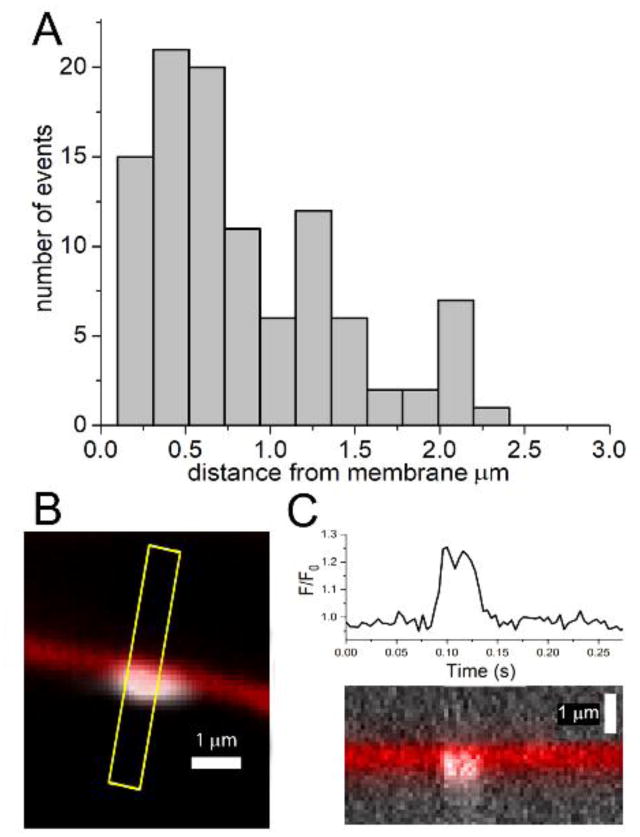
Fig. 6.

Proximity of puffs to the plasma membrane. (A) Distribution of distances of centroid locations of puff fluorescence ratio signals from the cell membrane. Data are from 100 events in the 6 cells illustrated in Fig. 5A. (B) Enlarged view illustrating a small Ca2+ event arising in immediate proximity to the plasma membrane. The membrane is depicted in red; the extent of the Ca2+ fluorescence signal averaged over its duration (40 ms, 10 frames) is depicted in white. (C) Upper panel shows the fluorescence ratio signal measured from a ~1 fl volume centered on the Ca2+ event, and the lower panel shows a kymograph image on the same timescale showing the position of the membrane and fluorescence signals (white) along the yellow line marked in (B).
