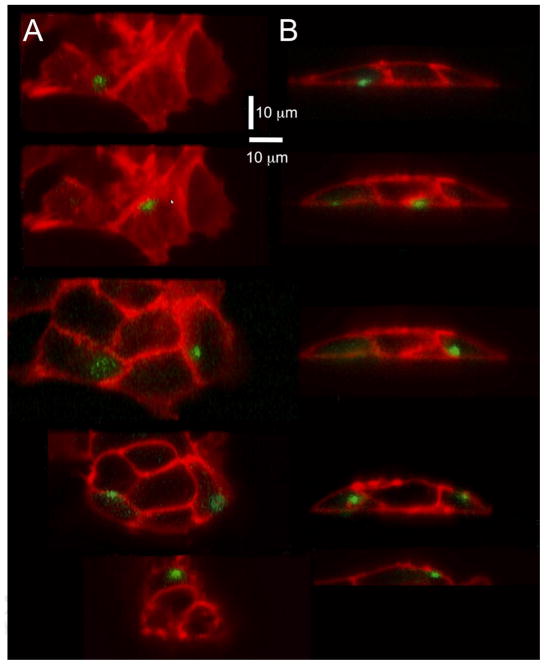
Fig. 8.
(A,B) show, respectively, x-y and y-z sections through a 3D reconstruction formed by scanning the light-sheet through a clump of SH-SY5Y cells. Individual slices (~ 50 × 25 μm) were acquired with 4 ms exposure time, and 64 sections were acquired in 400 nm increments to encompass a trapezoidal volume of about 50 × 25 × 25 μm at a rate of 280 ms per volume. Cells were stimulated by photorelease of i-IP3, and the pairs of panels show, respectively, top- and side-view sections of puffs (fluorescence ratio change, ΔF/F0, depicted in green) arising at different times and locations in the cells. The upper two pairs of panels show puffs arising at the cell membrane adjacent to the coverglass, and the other panels illustrate puffs arising at increasing distances above the coverglass. The sections in the left panels were taken at planes that intersected the puff sites. The lower panel in B was cropped by the trapezoidal geometry of the reconstruction, and shows only the ‘top’ of the cell.

