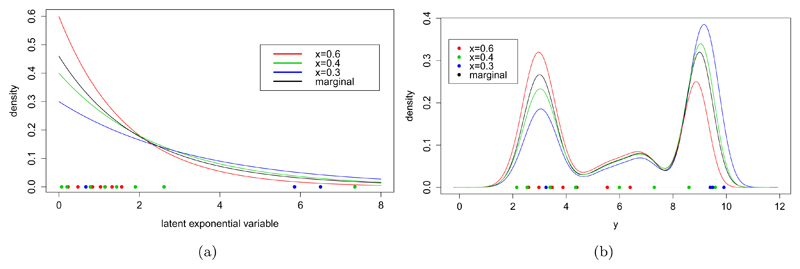
Fig 1.
Illustration of the latent variable used to capture the regression dependence. In (a) we show the distribution of the conditional latent variable, Z, at various points in X assuming a log-linear dependence. In (b) we see the corresponding predictive distributions using a Gaussian mixture model for the marginal, FY, shown as the black line. The points in Z shown in (a) are mapped to the points in Y shown in (b) where the ordering is preserved.

