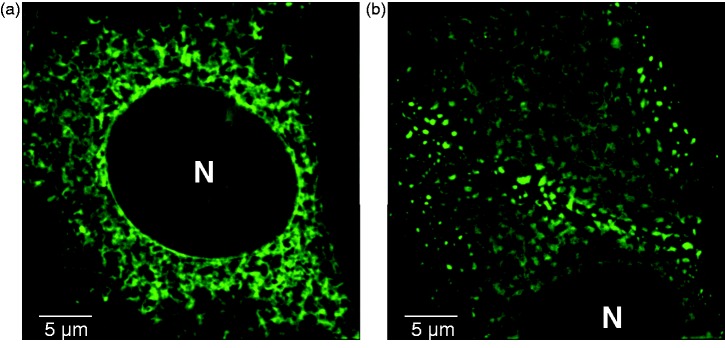
Figure 1.
STIM1 and STIM2 have a reticular ER distribution. NIH 3T3 cells transiently expressing STIM1-YFP (a) or STIM2-YFP (b). Images shown are a z-projection of a z-stack acquired on a Nikon’s N-SIM super resolution microscope. N: nucleus. (A color version of this figure is available in the online journal.)

