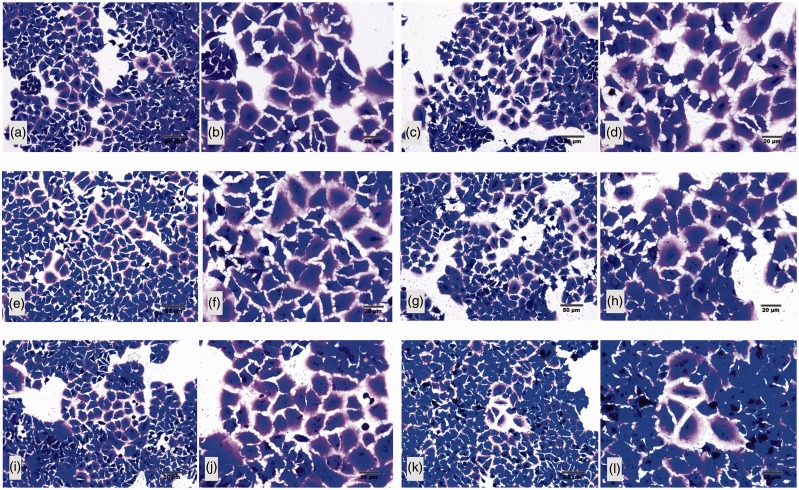
Figure 1.
Morphology of A549 apoptotic cells at five difference concentrations of HZ. The appropriate dose of HZ capable of inducing apoptosis in A549 cells was established by culturing the cells in the following concentrations of HZ: (a) 0 µM (negative control), (b) 2 µM, (c) 5 µM, (d) 10 µM, (e) 20 µM, and (f) 100 µM. Post induction, the intact cells showed large and cuboidal flattening and blue staining, whereas the apoptotic cells were small and starry like with hyperchromatic or dark nuclei. (A color version of this figure is available in the online journal.)

