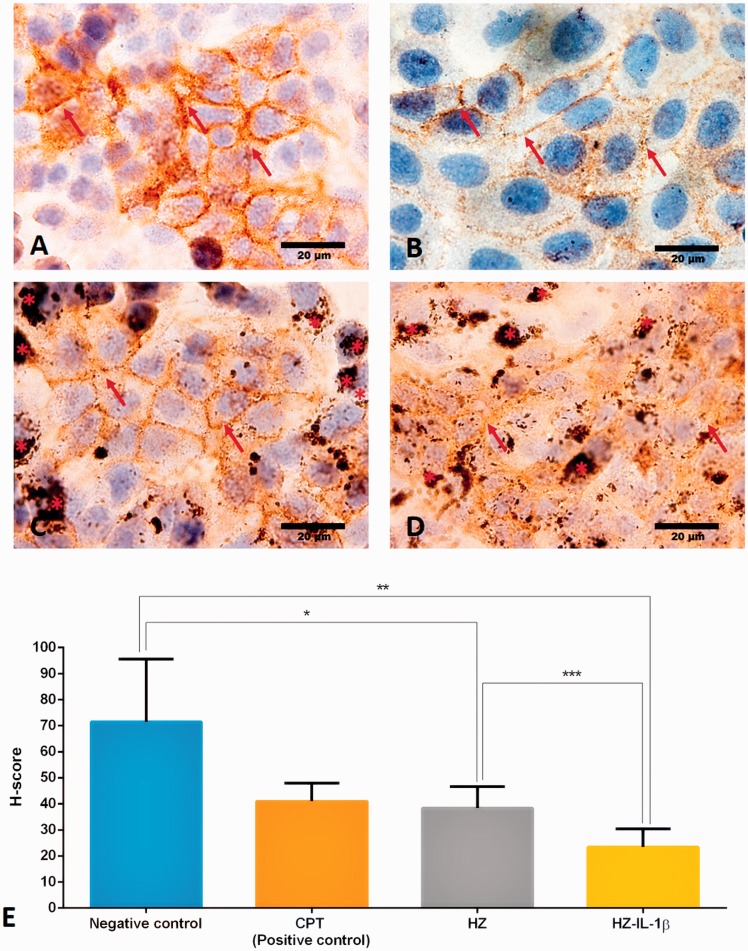
Figure 8.
Immunohistochemical staining of E-cadherin in A549 cells by treatment group. A549 cells co-cultured with HZ or HZ-IL-1β were able to suppress E-cadherin expression. (a) Cells in the no-treatment group had intensive brown staining (arrow), whereas the groups treated with (b) CPT, (c) HZ, or (d) HZ-IL-1β rarely showed DAB staining accompanying HZ accumulation (*). (e) H-scores were calculated from the percentage of an area of expression/high power field and the intensity score. The results show that all the treatment groups experienced down-regulated E-cadherin expression. The HZ-IL-1β treatment group had the most pronounced suppression of E-cadherin expression in the pneumocytes, and the CPT and HZ treatment groups less so when compared with the no treatment group. (A color version of this figure is available in the online journal.)

