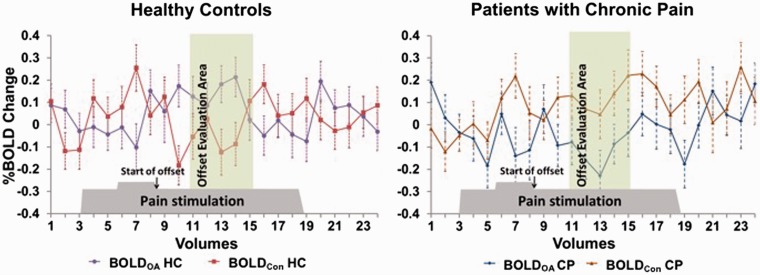
Figure 2.
Comparison of OA and Constant BOLD signals between healthy controls and patients with chronic pain at the brainstem. We compared BOLD signals during OA at the brainstem selectively during the 10-s “offset evaluation area,” beginning 6-s (hemodynamic delay) after the end of 1°C-increment (start of offset), with those during Constant stimulus. In HC (left panel), four out of five BOLD signals during OA (purple line) were larger than those during Constant (red line). In CP (right panel), all the BOLD signals during OA (blue line) were smaller than those of Constant (orange line). Error bars represents standard deviations.
OA: offset analgesia; HC: healthy control; CP: patients with chronic pain; BOLD: blood oxygenation level-dependent; Con: constant paradigm.

