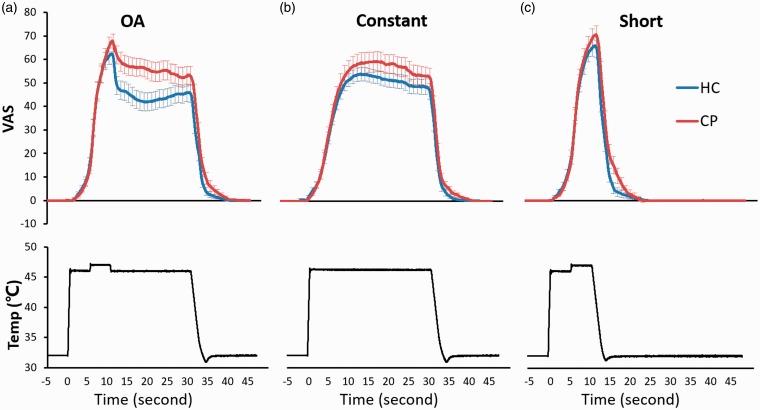
Figure 3.
Stimulation temperature, time, and pain ratings. Pain ratings of HC (blue line) and CP (red line) during OA (upper panel of A), Constant (upper panel of B), and Short (upper panel of C) are shown together with stimulation temperature (black line) of OA (lower panel of A), Constant (lower panel of B), and Short (lower panel of C). Error bars represent standard errors of the mean.
OA: offset analgesia; HC: healthy control; CP: patients with chronic pain; VAS: visual analogue scale; Temp: stimulation temperature.

