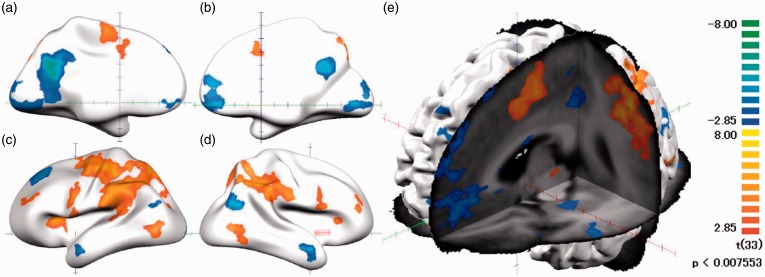
Figure 4.
Thermal pain-related activation. Activated brain regions during all three kinds of thermal pain stimulation compared with baseline shown in red to yellow and blue to green color on the brain mesh. Statistical strengths (t values) are color-coded as on the right bar. (a) Internal surface of the left hemisphere, (b) internal surface of the right hemisphere, (c) lateral surface of the left hemisphere, (d) lateral surface of the right hemisphere, and (e) three-sectional view of the left hemisphere.

