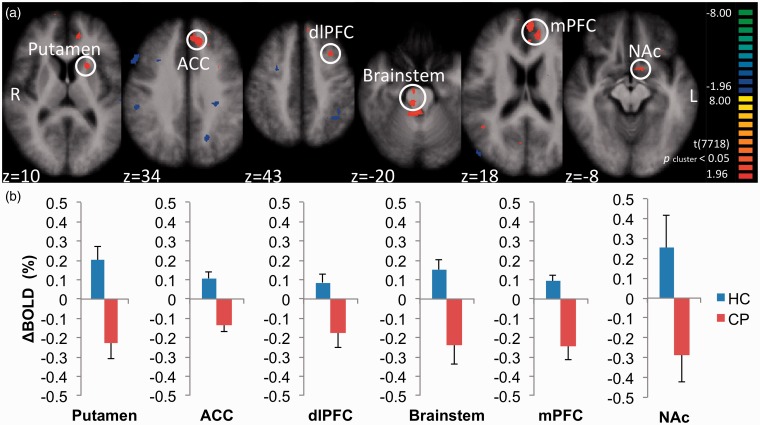
Figure 5.
Brain areas that showed larger OA-related BOLD signals in healthy controls than in patients with chronic pain. We performed a fixed-effects general linear model analysis on BOLD signal contrasts, [(HCOA − HCCon) − (CPOA − CPCon)], and indicated brain areas with positive and negative contrasts. From this subtraction analysis, we found that principal regions concerned with descending pain modulatory and reward systems were activated in HC but not in CP. (a) Six most robust positive clusters, color-coded in red to yellow, were selected as ROIs (white circle), including the left putamen, left ACC, left dlPFC, bilateral brainstem, bilateral mPFC, and left NAc. (b) Mean OA-related ΔBOLD of six ROIs shown in Figure 5(a) between HC (blue bar) and CP (red bar). Error bars represent standard errors of the mean.
ROI: region of interest; HC: healthy control; CP: patients with chronic pain; ACC: anterior cingulate cortex; mPFC: medial prefrontal cortex; dlPFC: dorsolateral prefrontal cortex; NAc: nucleus accumbens; BOLD: blood oxygenation level-dependent.

