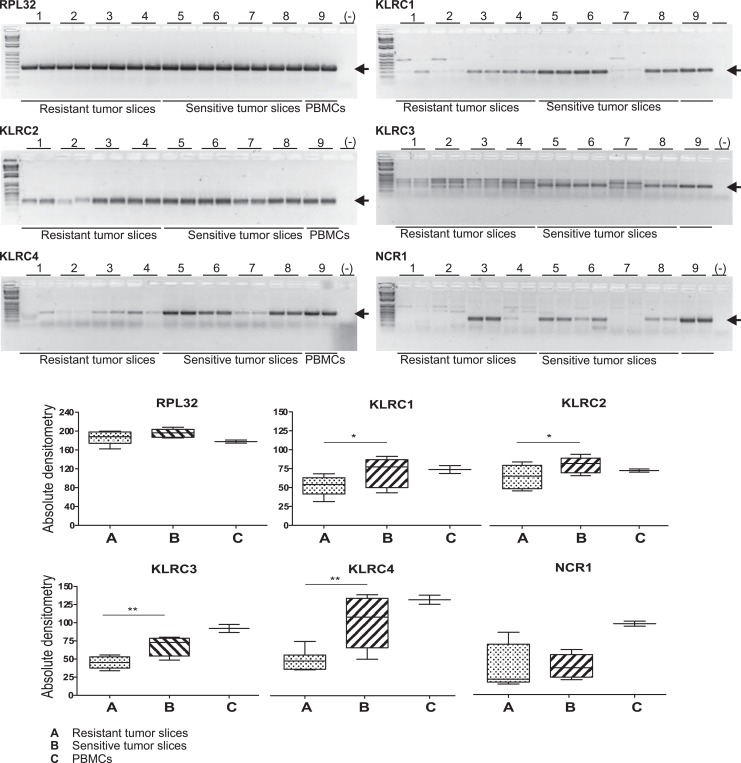
Figure 4.
Agarose DNA electrophoresis of polymerase chain reaction (PCR) amplification products from complementary DNA (Cdna) of tumor slices resistant or sensitive to antineoplastic treatment (upper panels), arrows are indicating the expected products. Bands outer the expected size were considered PCR artifacts, and the 1 kb plus DNA ladder was used. Periferal Blood Mononuclear Cells (PBMCs) amplification products were included as positive controls and RPL32 as reference gene. Densitometric comparisons are shown in the lower panels. *Indicates significant differences between groups (P < .05).

