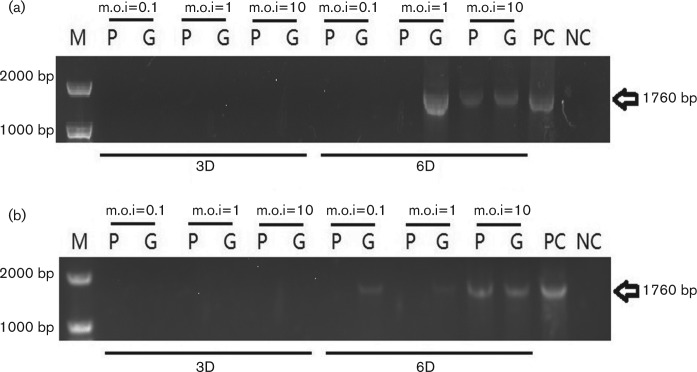
Fig. 2.
PCV1 full-length amplification results after the infectivity assay on BK cells. (a) Without d-glucosamine pretreatment. (b) With d-glucosamine pretreatment. P and G represent the PCV1-prototype virus and the PCV1-GSK virus, respectively. m.o.i. and sampling time points are marked above and below. PC and NC represent the positive and negative controls.

