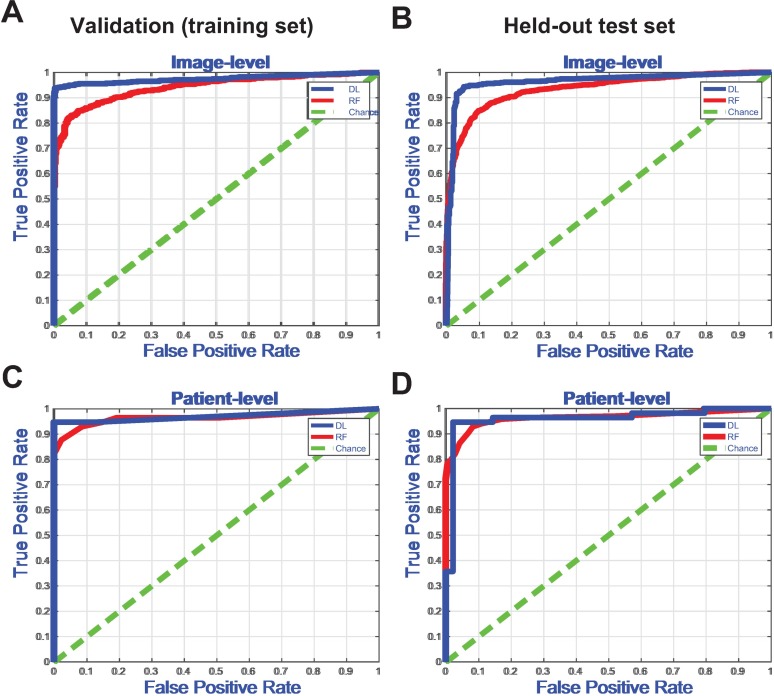
Fig 3. Receiver Operator Characteristic (ROC) curve for detection of clinical heart failure or severe tissue pathology.
(a) ROC curve for image-level detection on the training dataset (DL vs. RF, p < 0.0001, two-sample Kolmogorov-Smirnov (KS) test). (b) ROC curve for patient-level detection on the training dataset (DL vs. RF, ns, KS test). (c) ROC curve for image-level detection on the held-out test dataset (DL vs. RF, p < 0.0001, KS test). (d) ROC curve for patient-level detection on the held-out test dataset (DL vs. RF, ns, KS test).

