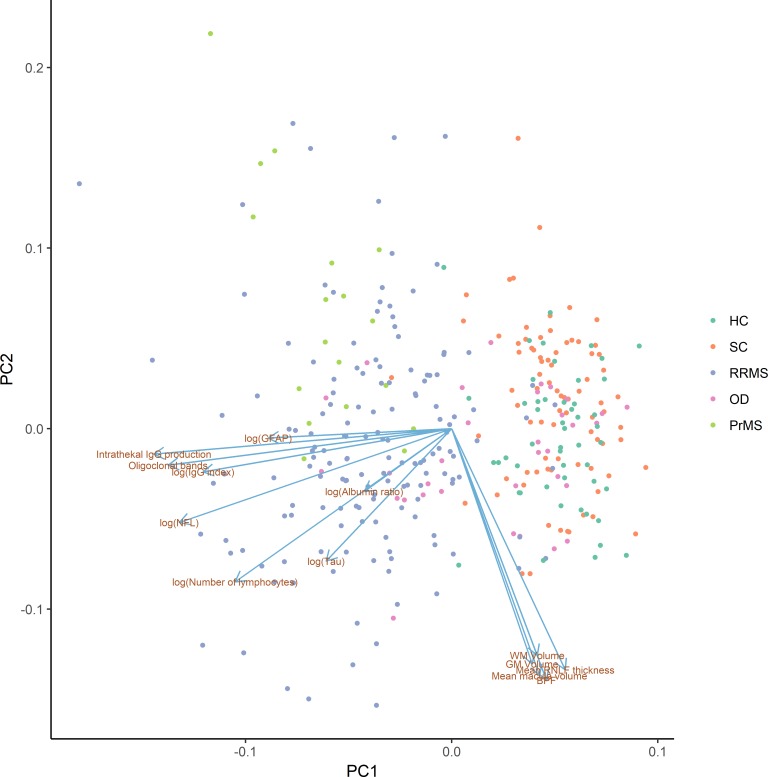
Fig 3. Scatterplot of data projected to the first two principal components (PC1 and PC2).
PC1 and PC2 explain 27.7% and 15.7% of the variability in data, respectively (total 43.4%). The projections of the biomarkers onto the principal components are shown as arrows. The HC and SC groups are mainly separated from the RRMS and PrMS groups by the biomarkers measured in the CSF. The OD group overlaps with both of the other groups.

