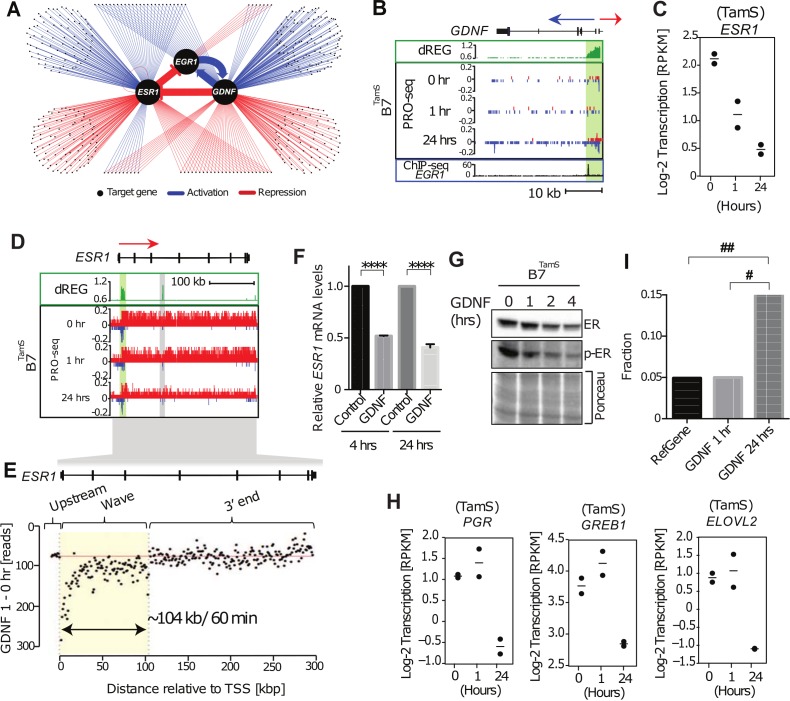
Fig 4. Bi-stable feedback loop between ESR1, EGR1, and GDNF.
(A) Transcriptional regulatory network of GDNF-dependent endocrine resistance highlighting the bi-stable feedback loop inferred between ESR1, EGR1, and GDNF. Each point represents a gene regulated following 1 or 24 hours of GDNF signaling. Only transcription factors or signaling molecules are shown. Blue and ref edges represent activation or repression relationships, respectively. (B) Transcription near the GDNF locus in B7TamS cells. PRO-seq densities on sense strand and anti-sense strand are shown in red and blue, respectively. dREG scores are shown in green. The promoter is shown in light green shading. Arrows indicate the direction encoding annotated genes. (C) Dot plots of transcription levels of ESR1 following GDNF treatment. (D) Transcription in the ESR1 gene in B7TamS cells. PRO-seq densities on sense strand and anti-sense strand are shown in red and blue, respectively. dREG scores are shown in green. Enhancers and promoters are shown in grey and light green shading, respectively. Arrow indicates the direction encoding annotated genes. (E) Difference in read counts in 3kb windows along ESR1 between 1 hours of GDNF and untreated TamS MCF-7 cells. The location of the wave of RNA polymerase along ESR1 was identified using a hidden Markov model and is represented by the yellow box. (F) ESR1 mRNA expression levels in B7TamS cells following 10 ng/mL GDNF treatment. Data are represented as mean ± SEM (n = 3). **** p <0.0001. (G) Immunoblot analysis of ERα and p-ERα in B7TamS cells treatment with 10 ng/mL for 0, 1, 2, and 4 hours. (H) Dot plots representing transcription levels of ERα target genes (PGR, GREB1, and ELOVL2) following a time course of GDNF treatment. (I) Bar plot showing the fraction of genes whose transcription is up-regulated by 40 min. of E2 in all RefSeq annotated genes (left) or those which are downregulated by 1 (center) or 24 hours (right) of GDNF treatment. E2 target genes were enriched in those down-regulated following 24 hrs of GDNF treatment. The Y axis denotes the fraction of genes that are direct up-regulated E2 targets (defined based on Hah et. al. (2011) and also up-regulated in B7TamS). # p = 1.098e-10, ## p = 6.556999e-19. Fisher’s exact test was used for statistical analysis.

