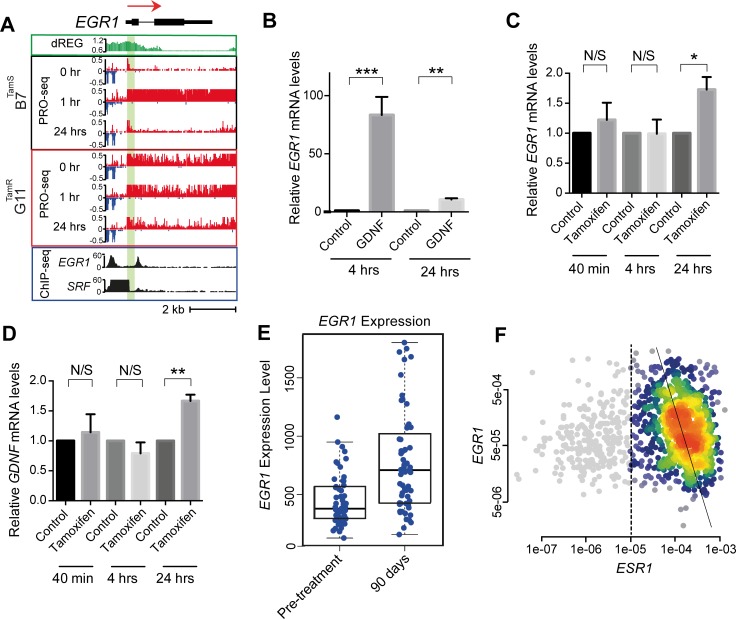
Fig 5. Validation of bi-stable feedback loop in MCF-7 cells and primary breast tumors.
(A) Transcription at the EGR1 locus in B7TamS and G11TamR cells before and after treatment with GDNF. PRO-seq densities on sense strand and anti-sense strand are shown in red and blue, respectively. dREG scores are shown in green. The number of reads mapping in EGR1 and SRF ChIP-seq data is shown in black. Arrow indicates the direction of annotated genes. (B) EGR1 mRNA expression level in B7TamS cell after treatment with 10 ng/mL GDNF for 4 or 24 hrs. Data are represented as mean ± SEM (n = 3). ** p < 0.01, *** p ≤ 0.001. (C) EGR1 mRNA expression level in G11TamR cells after treatment without (water) or with 10 ng/mL GDNF for 4 or 24 hrs. Data are represented as mean ± SEM (n = 3). * p < 0.05. (D) GDNF mRNA expression levels in G11TamR cells after treatment without (water) or with 10 ng/mL GDNF for 4 or 24 hrs. Data are represented as mean ± SEM (n = 3). ** p < 0.005. (E) Boxplots show EGR1 expression level before or following 90 days of treatment with letrozole (p = 1.8e-6, Wilcoxon Rank Sum Test). (F) Density scatterplots show the expression of EGR1 versus ESR1 based on mRNA-seq data from 1,177 primary breast cancers. ER+ breast cancers (n = 925), defined based on ESR1 expression (>1e-5), are highlighted in color. The trendline was calculated using Deming regression in the ER+ breast cancers (Pearson’s R = -0.21; p = 2.7e-10).

