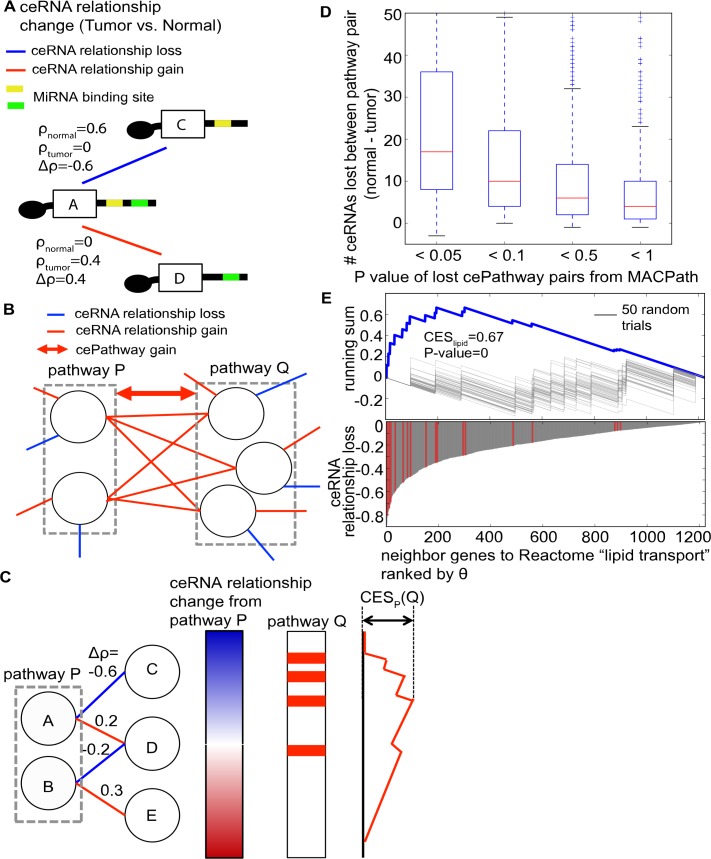
Fig 1. Identifying direct cePathway relationship dysregulations in tumors.
(a). An illustration of ceRNA relationship change network. RNA A shares a significant number of miRNA binding sites with RNA C and D, where ρnormal and ρtumor represent their co-expression in normal and tumor samples, respectively. Between normal and tumor samples, co-expression decrease in tumors (Δρ = ρtumor-ρnormal<0) between A and C could represent their ceRNA relationship loss and co-expression increase (Δρ>0) between A and D represent their ceRNA relationship gain. (b). An example of a cePathway relationship gain between pathway P and Q in the ceRNA relationship change network. CePathway relationship loss would be identified in the same fashion.(c). An illustration of MACPath to identify cePathway relationship dysregulation between pathway P and Q. Genes showing ceRNA relationship changes from pathway P are sorted by the magnitude of the changes (θP from Def. 2, blue for loss and red for gain in the left bar). On the genes ranked by θP, a running sum is calculated for genes in pathway Q (in the right bar). The maximum variation of the running sum from 0 is the ceRNA relationship change enrichment score (CESP(Q)). (d). The number difference of ceRNAs between pathway pairs (normal vs. tumor) divided by P value MACPath estimated for the pairs. (e). Upper panel shows behavior of running sum between Reactome "lipid transport" pathway and PID "HIF1 TF" pathway. Gray lines represent running sum of 50 permutation trials. Lower panel shows θ of neighbor genes to Reactome "lipid transport" pathways ranked by their θ. Red lines indicate where genes in PID “HIF1 TF” are placed.

