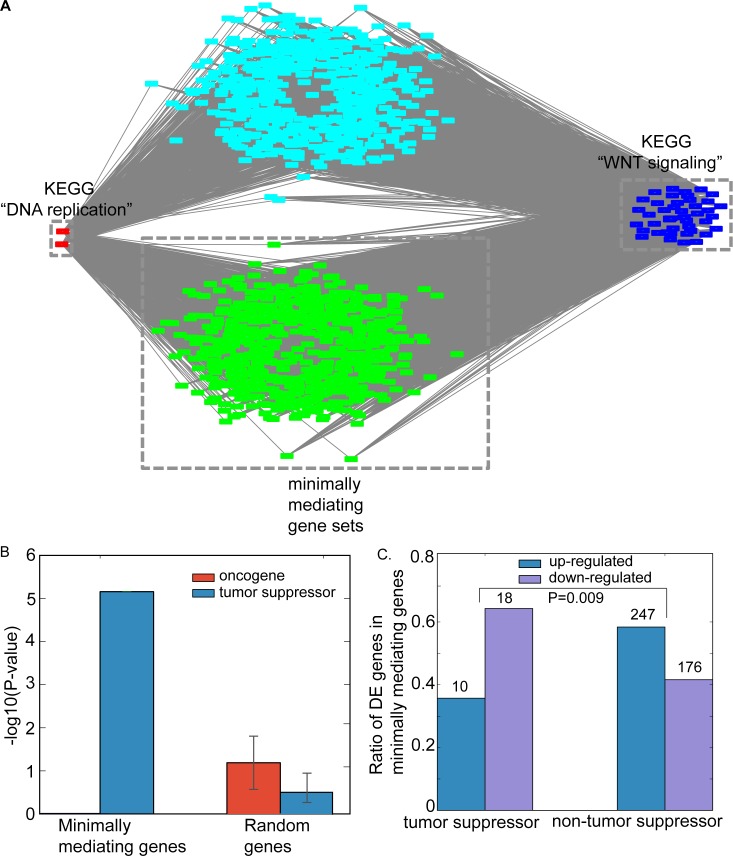
Fig 4. The lost indirect cePathway relationship between KEGG “DNA replication” and KEGG “WNT signaling”.
(a). Red nodes are ceRNA genes of KEGG “DNA replication” and blue nodes are those of KEGG “WNT signaling”. 1,132 genes (green and light blue nodes) mediate the ceRNA loss between the pathways, where green nodes are 615 minimally mediating gene set. Visualization is taken from Cytoscape[27]. (b). Enrichment of the minimally mediating genes to oncogenes (red) and tumor suppressors (blue) compared to the same number of random genes. Error bar represents standard variation values from 100 random trials. (c). Ratio of differentially expressed tumor suppressors in the set of the mediating genes compared to other genes in the set. EdgeR estimates differential expression with FDR-corrected P value < 0.05.

