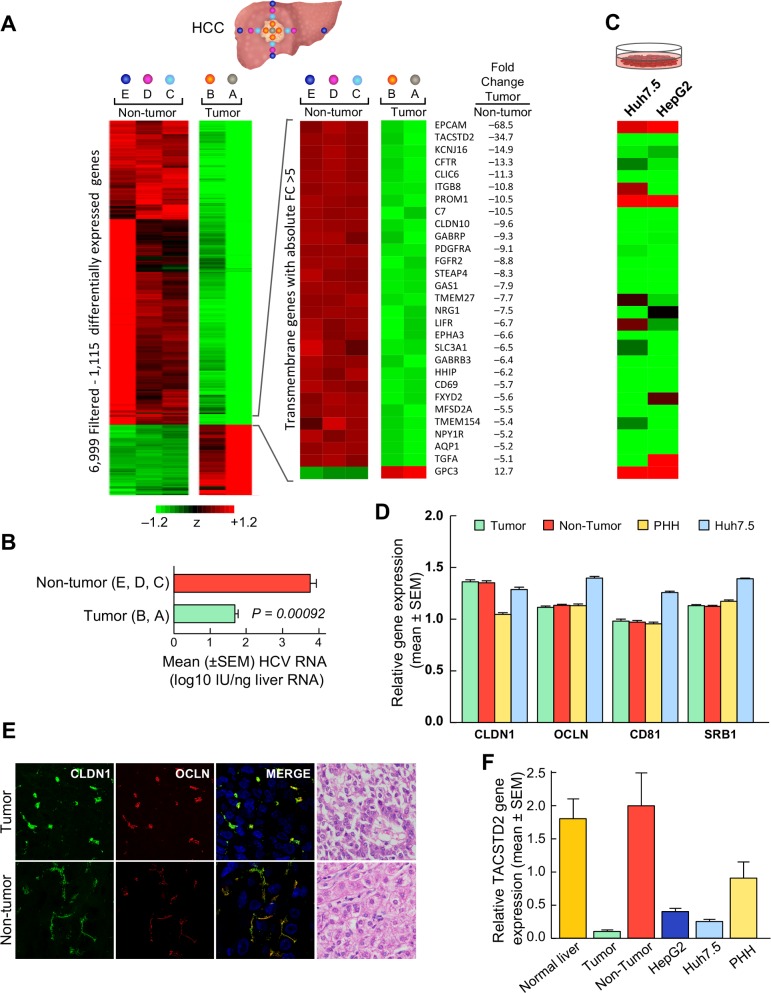
Fig 1. Gene expression profiling and HCV RNA in tumor and nontumorous liver tissue of patients with HCV-associated HCC.
(A) Liver samples were obtained from five different liver areas: the center of the tumor (A, 8 samples), the periphery of the tumor (B, 29 samples), the perilesional nontumorous area outside the tumor margin (C, 21 samples), the area at a distance of 2–3 cm from the margin of the tumor (D, 22 samples), and the most distant nontumorous area, on the edge of the liver (E, 23 samples). Data from the center of the tumor area (A) represent individual samples, whereas data from each of the other liver areas (B to E) represent the average of multiple specimens obtained in the 4 directions. Differentially expressed genes (n = 1,115) were identified by comparing A (tumor) and E (non-tumor) areas (FDR<1%). The heatmap shows the standardized expression of the 1,115 genes in all five liver areas. Genes whose expression was above the mean are shown in shades of red, and genes whose expression was below the mean are shown in shades of green. The full range of colors, from green to red, is ± 1.2 SD. The heat map and fold changes of the most upregulated transmembranes genes are also shown. (B) HCV RNA shows a significant drop in the tumorous areas (A, B), as compared to the surrounding nontumorous areas (C, D, E). The bars represent the mean ± SEM. The data presented in this figure on the levels of HCV RNA in the tumor and surrounding nontumorous tissue from these patients were previously reported [18]. (C) Heat map representing the most upregulated transmembrane genes in hepatoma cell lines: Huh7.5 and HepG2. (D) Quantitative RT-PCR of the 4 HCV-entry cofactors CLDN1, CD81, OCLN, and SR-B1 in tumor, nontumorous tissue, Huh7.5 cells, and primary human hepatocytes (PHH). Data represent the log2-transformed ratio of each co-receptor to GAPDH. No differences were found between tumor and non-tumor in any of the 4 HCV-entry cofactors. Comparable levels were also observed for PHH except for a lower expression of CLDN1, whereas Huh7.5 showed a higher expression of 3 entry cofactors (CD81, OCLN and SR-B1). (E) Visualization of CLDN1 (green surface rendering) and OCLN (red surface rendering) in tumor and non-tumor specimens in a representative patient who exhibited a 3 log drop in HCV RNA levels within the tumor by immunofluorescence staining. Two patterns of CLDN1 and OCLN cellular distribution were documented: the tumor shows a clumpy distribution of CLDN1 and OCLN whereas the matching nontumorous tissue shows a regular linear distribution along the cellular membrane. DAPI is represented in blue. Overlay images show all channels in 3D volume rendering. The H&E images show the tumor and nontumorous liver specimens of the same patient (40X). (F) Quantitative RT-PCR of TACSTD2. Mean relative quantities are normalized to the non-tumor tissue, expressed as 2-ΔΔCT, where ΔΔCT is the average difference between the target tissue ΔCT and the non-tumor tissue ΔCT.

