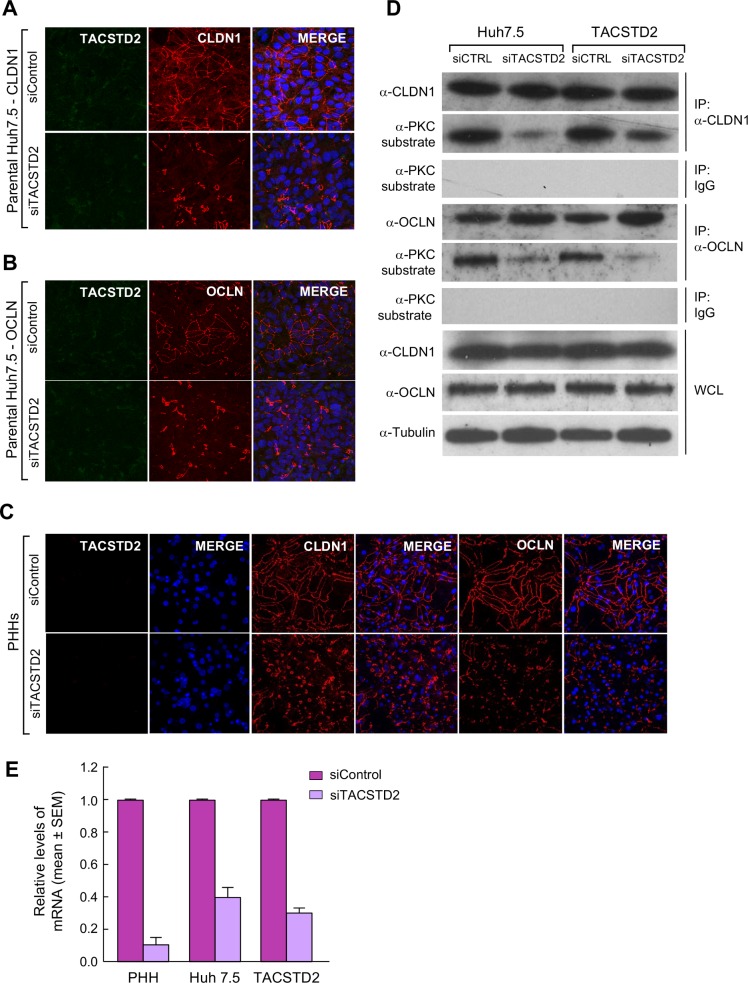
Fig 3. TACSTD2 gene silencing disrupts CLDN1 and OCLN cellular localization in hepatoma cells and primary human hepatocytes.
(A) Visualization of TACSTD2 (green) and CLDN1 (red) in parental Huh7.5 cells transfected with siTACSTD2 or an irrelevant siRNA (siControl). CLDN1 appears speckled and fragmented in siTACSTD2-treated cells but maintains its regular linear pattern along the cellular membrane in siControl-treated cells. (B) Visualization of TACSTD2 (green) and OCLN (red) in parental Huh7.5 cells transfected with siTACSTD2 or siControl. OCLN appears speckled and fragmented in siTACSTD2-treated cells but maintains its regular linear pattern along the cellular membrane in siControl-treated cells. (C) Visualization of CLDN1 and OCLN in primary human hepatocytes transfected with siTACSTD2 or siControl. Both CLDN1 and OCLN appear speckled and fragmented in siTACSTD2-treated cells but maintain their regular linear distribution along the cellular membrane in siControl-treated cells. (D) TACSTD2 gene silencing results in the reduction of phosphorylation levels of CLDN1 and OCLN in both parental and TACSTD2-overexpressing Huh7.5 cells. Cell lysates from both parental and TACSTD2-overexpressing Huh7.5 cells were immunoprecipitated with anti-CLDN1 and anti-OCLN antibodies or control IgG, at 72h after transfection with either siControl or siTACSTD2. Phosphorylated CLDN1 and OCLN were detected using an anti-PKC substrate-specific antibody; total CLDN1 and total OCLN were detected using anti-CLDN1 and anti-OCLN specific antibodies, respectively. Whole cellular lysates were simultaneously subjected to immunoblotting using anti-CLDN1 and anti-OCLN antibodies. (E) RT-PCR quantification of TACSTD2 in siControl- and siTACSTD2-transfected cells, expressed as 2-ΔΔCT, where ΔΔCT is the average difference between the siTACSTD2 ΔCT and siControl ΔCT.

