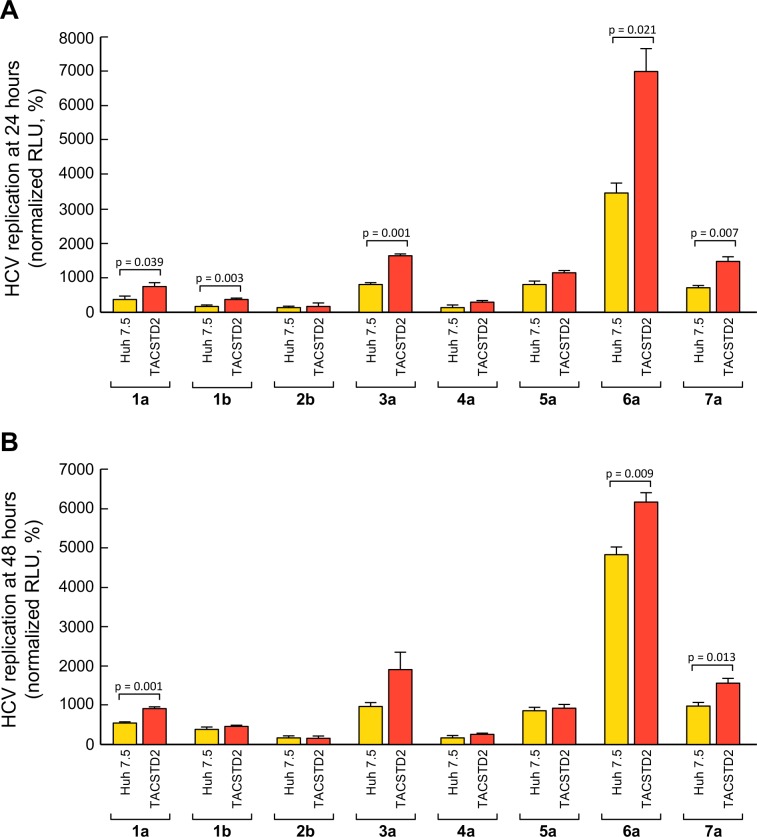
Fig 7. HCV infection in parental and TACSTD2 overexpressing Huh7.5 cells.
Parental and TACSTD2 overexpressing Huh7.5 cells were infected with HCV 1a, 1b, 2b, 3a, 4a, 5a, 6a and 7a. At 24h (A) and 48h (B) post-infection, virus replication was assessed by measurement of luciferase activity. Values are represented as relative light units (RLU), and represent the mean ± SEM (n = 3). In both panels, statistically significant differences calculated by t-test between Huh 7.5 cells and TACSTD2 overexpressing cells are shown.

