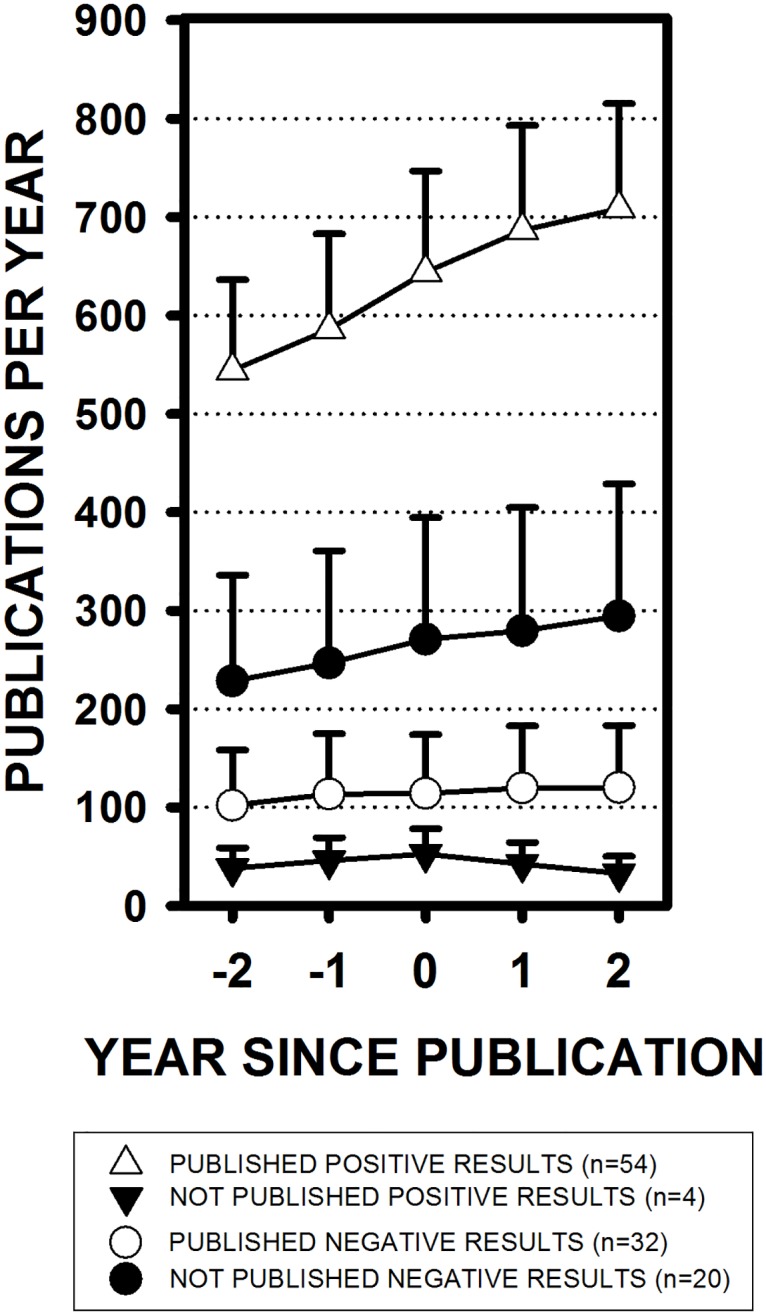
Fig 4. Research activity levels by study outcome.

The number of papers published each year on the same topics as the studies included in the present analysis (means ± SEM). Publication years range from two years before (-2) until two years after the year the studies included in the present analysis were either completed or published (year 0). For example, even two years before the publication of the studies reporting positive results, on average, 544 ± 92 papers were already being published each year on those same topics. Two years before the publication of the studies reporting negative results, only 102 ± 56 papers were being published each year on those topics.
