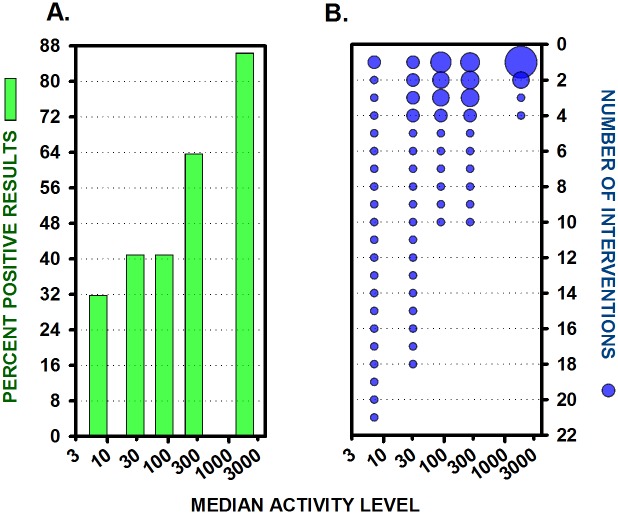
Fig 5. Success rates increase and number of topics decrease as research activity levels increase.
(A) Percent successful, or positive, statistically significant results, at median activity levels for 5 equal groups (n’s = 22). (B) The number of interventions or topics of research is shown at each activity level. Symbol size indicates the number of studies being conducted on the same topic. The Y axes is inverted in this panel in order to convey the concept that, over time, only a small number of reliable findings rise to the top.

