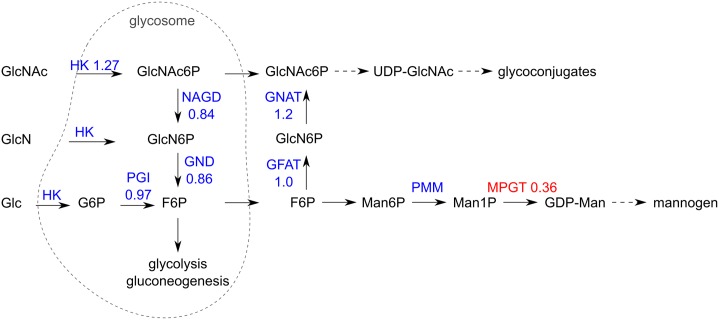
Fig 11. Scheme of mannogen biosynthesis.
Blue and red colours indicate enzymes and their relative mRNA abundance in Δtkt when compared to WT. GlcNAc, N-acetylglucosamine; GlcN, glucosamine; Glc, glucose; GlcNAc6P, N-acetylglucosamine 6-phosphate; GlcN6P, glucosamine 6-phosphate; G6P, glucose 6-phosphate; F6P, fructose 6-phosphate; Man6P, mannose 6-phosphate; UDP-GlcNAc, uridine diphosphate N-acetylglucosamine; GDP-Man, guanosine diphosphate mannose; HK, hexokinase; PGI, glucose-6-phosphate isomerase; NAGD, N-acetylglucosamine-6-phosphate deacetylase; GND, glucosamine-6-phosphate deaminase; GNAT, glucosamine-6-phosphate acetylase; GFAT, glutamine:Fru6P aminotransferase; PMM, phosphomannomutase; MPGT, mannose-1-phosphate guanylyltransferase; dashed arrows indicate multiple enzymatic steps; based om Naderer, et al. [36] and Garami, et al. [70].

