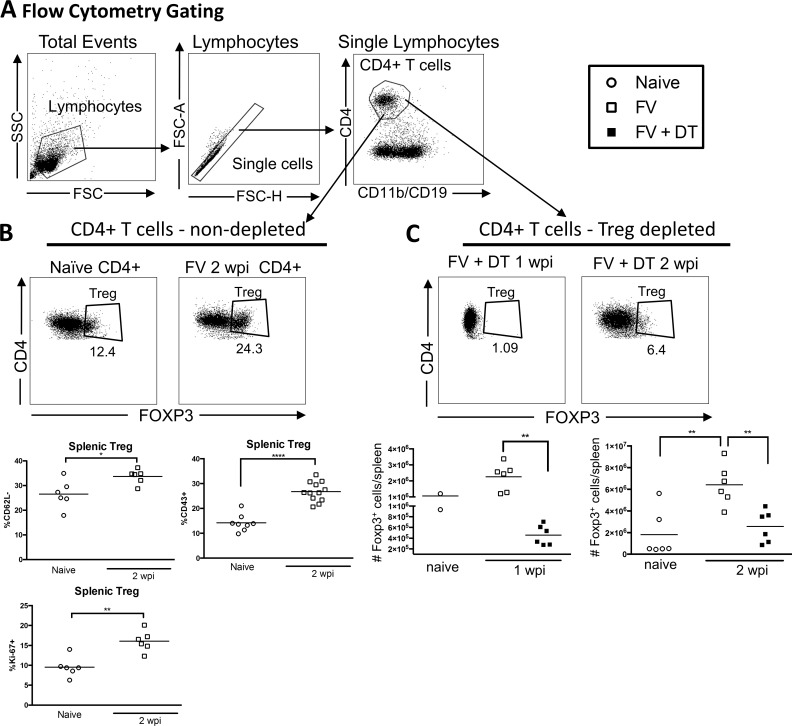
Fig 1. Depletion of Tregs during FV infection.
Gating strategy for Tregs (A-C). B6-FOXP3-DTR mice were injected with 20,000 SFFU i.v. FV and left untreated (B) or injected with DT on day 0, 3, and 6 relative to infection (C). Spleens were harvested at 1 (C) or 2 wpi (B, C) and cells were analyzed by flow cytometry compared to naïve mice. (B) Splenic Tregs from non-depleted mice were analyzed for CD43, CD62L and Ki-67 expression, represented as a percentage of Tregs. (C) The total number of Tregs at 1 wpi or 2 wpi with or without Treg depletion was compared to the levels in naïve mice. Each dot represents an individual mouse pooled from experiments with 2–6 mice per group. Lines indicate the mean of each group. * P < .05, **P < .01, ****P < .0001 as determined by ordinary one-way ANOVA with Tukey post-test for multiple comparisons or an unpaired two-tailed t test for comparisons between only two groups.

