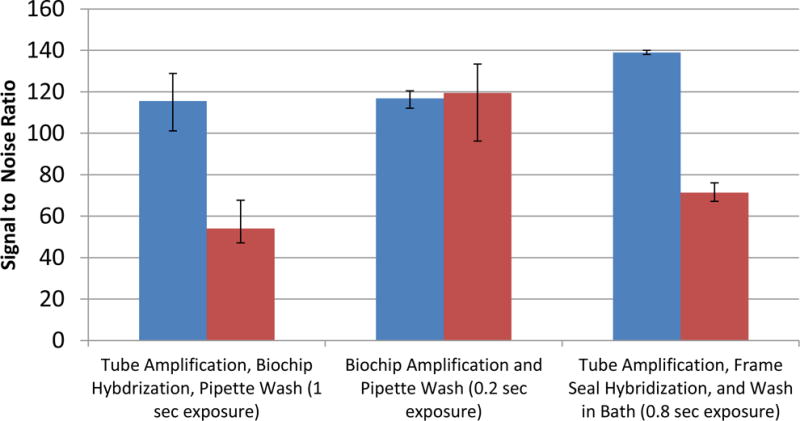
Figure 3.

Microarray signal comparison between the flow cell and Frame-seal methods using the Wound v2.0 array according to the following conditions: 1) tube amplification and hybridization in the flow cell followed by a pipet wash and on-chip drying protocol, 2) flow cell amplification followed by a pipet wash and on-chip drying protocol, and 3) tube amplification followed by Frame-Seal hybridization, washing in a bath and air drying. In each case 104 genomic copies of S. pyogenes is amplified (n=3). The integral spot intensity minus the local background of two targets spots divided by the standard deviation of the background are used to calculate the signal to noise ratios shown. Using an Aurora Port Array 5000, the images are acquired for exposure times up to the duration when the spots are just below saturation.
