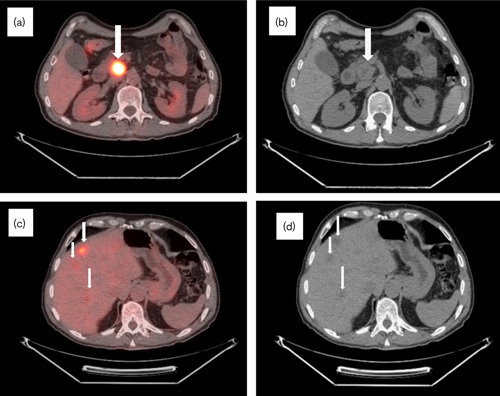
Fig. 1.

Initial CT/PET at biopsy in April 2007. (a) CT/PET and (b) CT scan: metabolically active (SUV 16) hypodense 4.5×3.7×3.7 cm lesion in the uncinate process of the pancreas (arrows). (c) CT/PET and (d) CT scan: multiple metabolically active lesions throughout liver parenchyma, with the largest measuring 2.8×1.8 cm (SUV 7) (arrows). CT, computed tomography; SUV, standardized uptake value.
