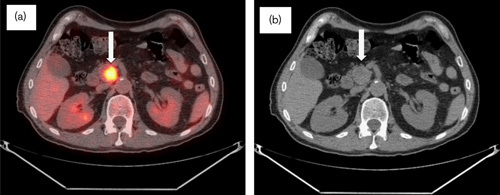
Fig. 5.

Follow-up CT/PET in November 2009 now 2.5 years after diagnosis. (a) CT/PET and (b) CT scan: interval decrease in the size of the pancreatic uncinate process mass measuring 2.6×2.2×2.3 cm. Hypermetabolic activity showed increase from the previous scan (SUV 10) (arrows). The hepatic parenchyma remained free of hypermetabolic activity or focal lesions (not pictured). No biliary dilatation noted. CT, computed tomography; SUV, standardized uptake value.
