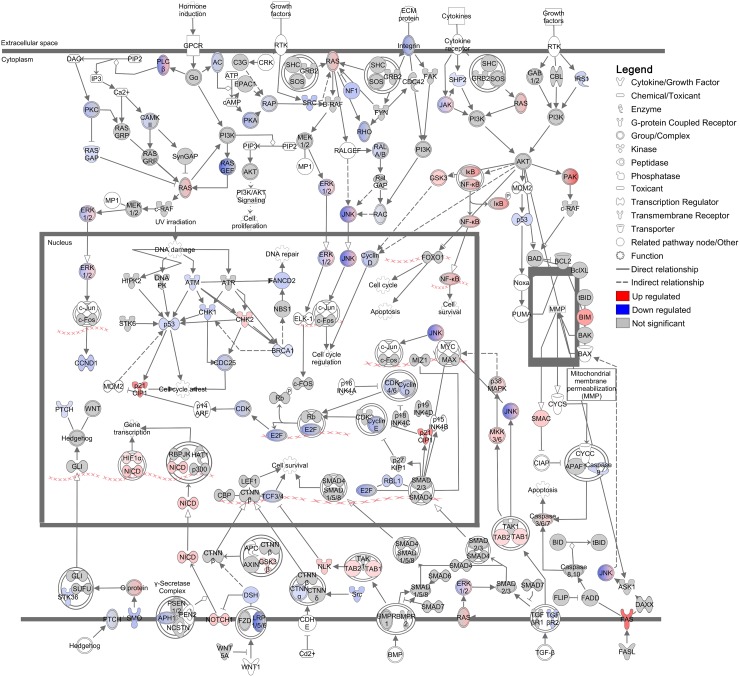
Figure 4. Regulation of ‘Molecular mechanisms of cancer’ canonical pathway in DFT1 cells by imiquimod.
C5065 DFT1 cells were treated with imiquimod at 60 μg/ml for 24 h. The transcriptome of treated and untreated cells was analysed by RNA-seq and IPA was used to predict canonical pathways regulated by imiquimod treatment. The canonical pathway most significantly associated with genes regulated by imiquimod treatment is shown. Up-regulated genes are coloured red and down-regulated genes are coloured blue.

