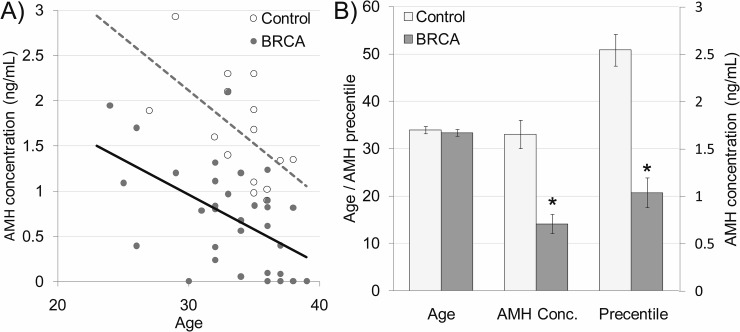
Figure 1. Serum anti-Mullerian hormone (AMH) in BRCA mutation female carriers.
(A) Scatter plot representing serum AMH levels in 15 non-carrier females (control; white dots; dashed grey regression line) and 33 BRCA mutation carrier females (BRCA; grey dots; continues black regression line). (B) Age, serum AMH concentration and AMH levels percentiles in non-carrier females (control; light gray bars) and BRCA mutation carriers (BRCA; dark gray bars). Each bar is mean ±SEM. * significantly different from corresponding control value (P<0.05).

