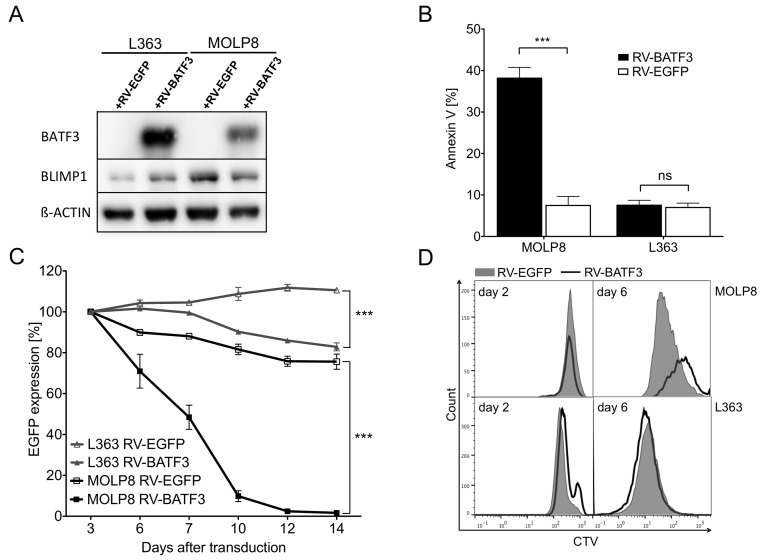
Figure 4. BATF3-overexpression leads to downregulation of BLIMP1 and apoptosis in multiple myeloma (MM) cell line MOLP8.
(A) Expression of BLIMP1 and BATF3 in MM cell lines MOLP8 and L363 after retroviral transduction with BATF3 (+RV-BATF3) or EGFP (+RV-EGFP) as a control. Ectopic BATF3-expression induced a downregulation of BLIMP1 in MOLP8 cells, whereas BLIMP1 was found to be upregulated in L363 cells after BATF3-transduction. (B) BATF3-induced apoptotic cell death in MM cell line MOLP8. Seven days after transduction with BATF3, MOLP8 cells showed an increased fraction of apoptotic cells (left black bar) when compared to control-gene transduced cells (left open bar). BATF3-overexpression in L363 cells did not lead to increased apoptosis (right black and open bars). (C) BATF3-expression dramatically impaired cell growth of MM cell line MOLP8 (black line with solid square). On the other hand, control-gene modified MOLP8 cells (black line with open square) and transduced L363 cells (grey line with solid or open triangles) did not show reduced expansion. (D) Proliferation of MM cell lines MOLP8 and L363 after transduction with BATF3 or control gene EGFP. Directly after transduction, both cell lines were labeled with the cell-division tracker CellTrace Violet (CTV) and were analyzed by flow cytometry on days 2 and 7. Subsequently, flow cytometric analysis on day 7 revealed that BATF3-expressing MOLP8 cells (solid line) compared to EGFP-modified control cells (grey area) showed a reduced proliferation. L363 cells were not affected in their proliferation capacity after BATF3-overexpression. Error bars represent standard deviation. Statistical significance was established with a paired t test. All experiments were performed in triplicates. ***, P < 0.0001, ns, not significant

