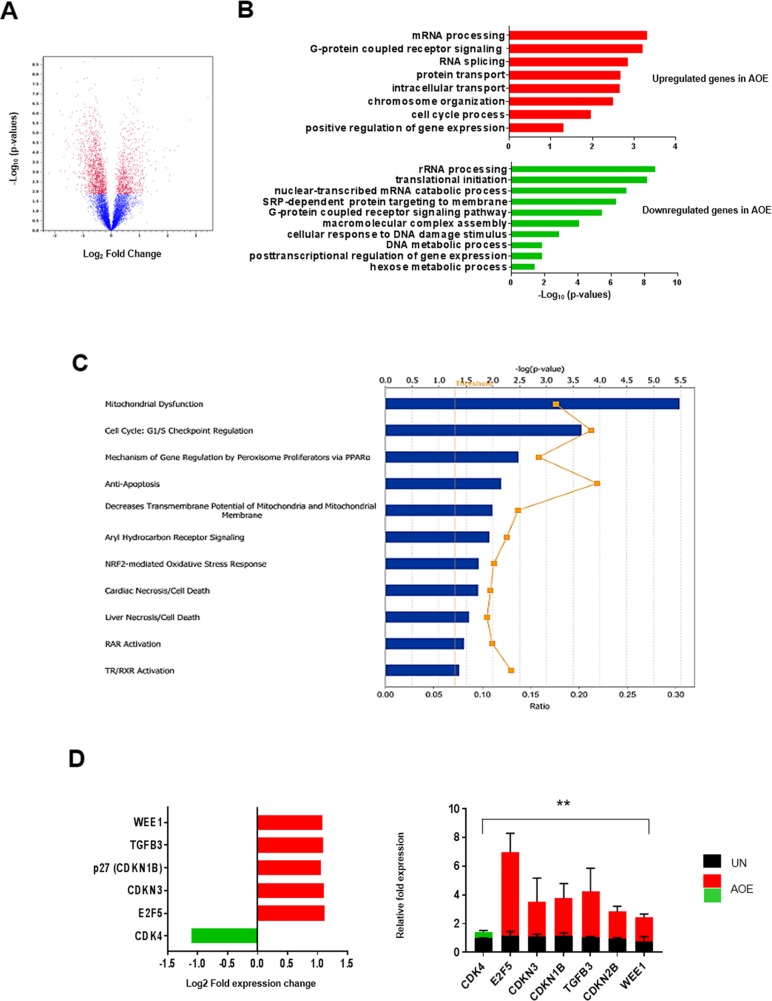
Figure 1. Gene expression analysis of AOE-reprogrammed tumour xenografts.
(A) Volcano plot of differentially expressed gene in AOE-treated versus untreated (UN) tumour xenografts. Differentially expressed genes were determined with a cut-off for adjusted p-value established at 0.05 and fold change value at ± 2 (n=6). Red dots show genes which are diffrerentially expressed above a 2-fold threshold. The part of the graft on the left of the zero point represents genes which are downregulated in AOE-treated tumours (1235), whereas the one on the right represents genes which are upregulated in AOE-treated tumours (741). (B) Bar plot ranking the enrichment score of GO biological processes for upregulated and downregulated genes in AOE-treated tumours compared to untreated. (C) Best match canonical pathway by IPA. Functional pathways are presented in descending order of significance (p<0.05, with threshold specified by yellow dotted line). The yellow graph line indicates the ratio between the numbers of genes from the dataset and the total number of genes involved in those pathways. (D) Fold change in gene expression as determined by microarray analysis (left) and TaqMan® qRT-PCR (right). Quantitative RT-PCR results for each gene are presented as relative fold expression to RPLP0 and the UN group used as calibrator (n=3). Relative fold expression levels were analysed by unpaired Student’s t-test. **p< 0.01. Green and red bars indicate downregulated or upregulated genes in AOE, respectively.

