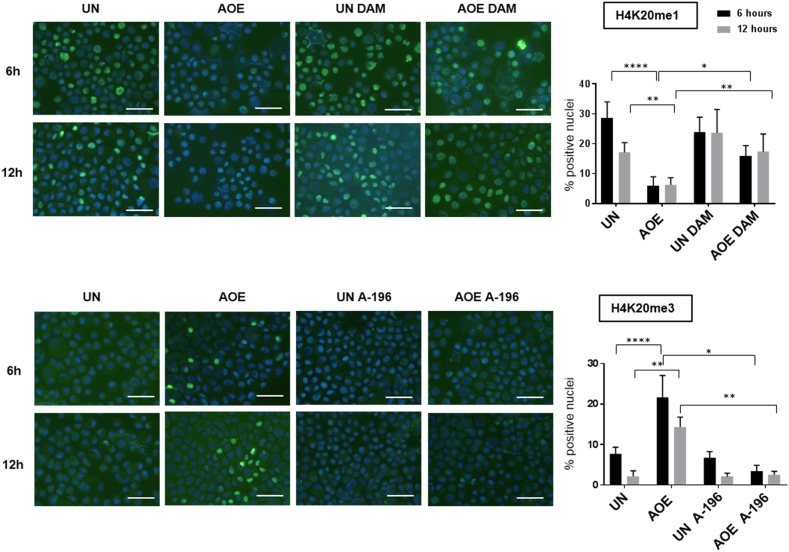
Figure 9. H4K20me1 and H4K20me3 staining of untreated and AOE-treated cells in the presence of inhibitors of SUV420H1/H2 and PHF8.
H4K20me1 and H4K20me3 staining of cells incubated in growth medium (UN) or AOE for 6 hours in the presence or absence of Daminozide (DAM) or A-196. Cells were analysed immediately after reprogramming (6 hours) and after overnight culture (12 hours). Histogram shows the % of positively stained nuclei (n= 2; 5 fields of view). Staining levels were analysed by Two-way Anova followed by Bonferroni’s multiple comparisons test. *p< 0.05. **p<0.01, ****p<0.0001. Scale bar = 50μm.

