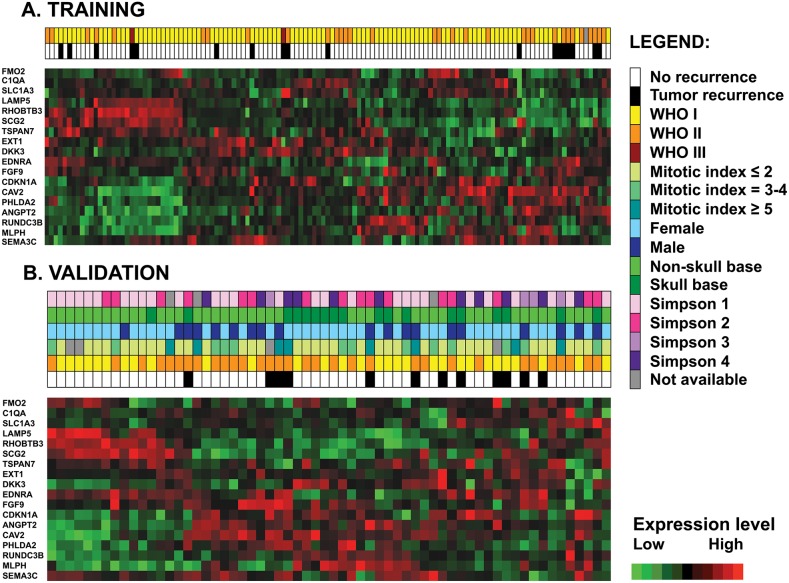
Figure 3.
Unsupervised hierarchical clustering with the 18 model probe sets in the training dataset (n=127) (A) and in the validation dataset (B) shows similar patterns of gene expression. Each row represents a probe set and each column represents a sample. Expression values are shown after batch normalization.

