. 2018 Mar 25;11(1):112–119. doi: 10.3400/avd.oa.17-00114

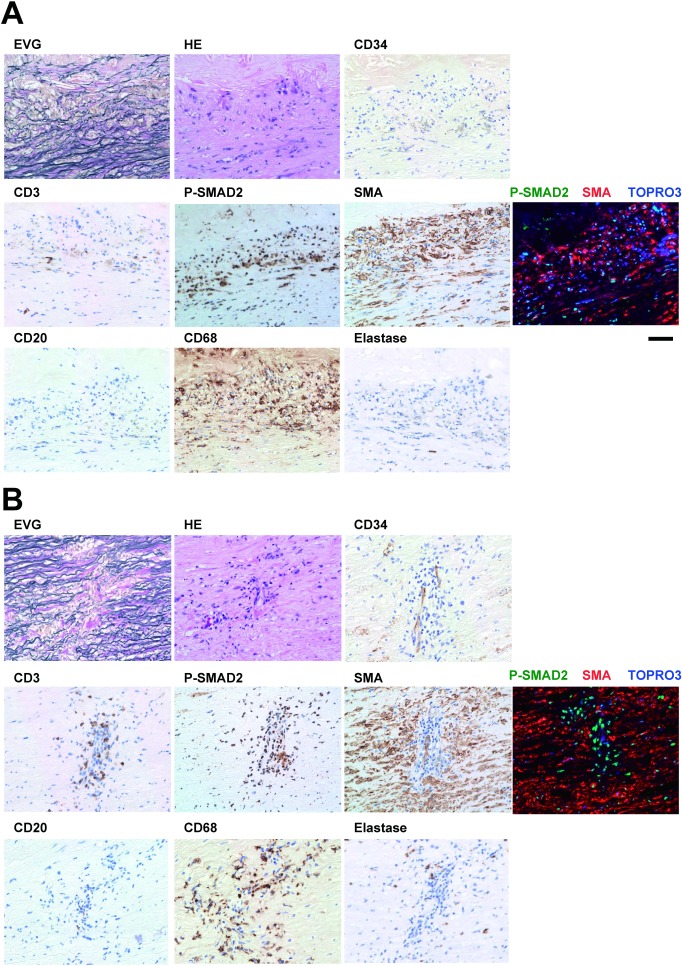
Fig. 3 Characterization of the TAA tissue with activated SMAD2. Representative images are shown for the areas corresponding to the layer-like staining of P-SMAD2 (A) and spot-like staining of P-SMAD2 (B). Photomicrograms indicate histochemical staining with EVG and H & E, and immunohistochemical staining for the T cells (CD3), P-SMAD2, smooth muscle cells (SMA), B cells (CD20), macrophages (CD68) and neutrophils (Elastase). Nuclear staining with hematoxylin in immunohistochemical stainings served as counter staining. Photomicrograms of the immunofluorescence staining for P-SMAD2 (green), SMA (red), and nuclei (TOPRO3, blue) are also shown. Bar 50 µm.

Fig. 3 Characterization of the TAA tissue with activated SMAD2. Representative images are shown for the areas corresponding to the layer-like staining of P-SMAD2 (A) and spot-like staining of P-SMAD2 (B). Photomicrograms indicate histochemical staining with EVG and H & E, and immunohistochemical staining for the T cells (CD3), P-SMAD2, smooth muscle cells (SMA), B cells (CD20), macrophages (CD68) and neutrophils (Elastase). Nuclear staining with hematoxylin in immunohistochemical stainings served as counter staining. Photomicrograms of the immunofluorescence staining for P-SMAD2 (green), SMA (red), and nuclei (TOPRO3, blue) are also shown. Bar 50 µm.