
Figure 2.
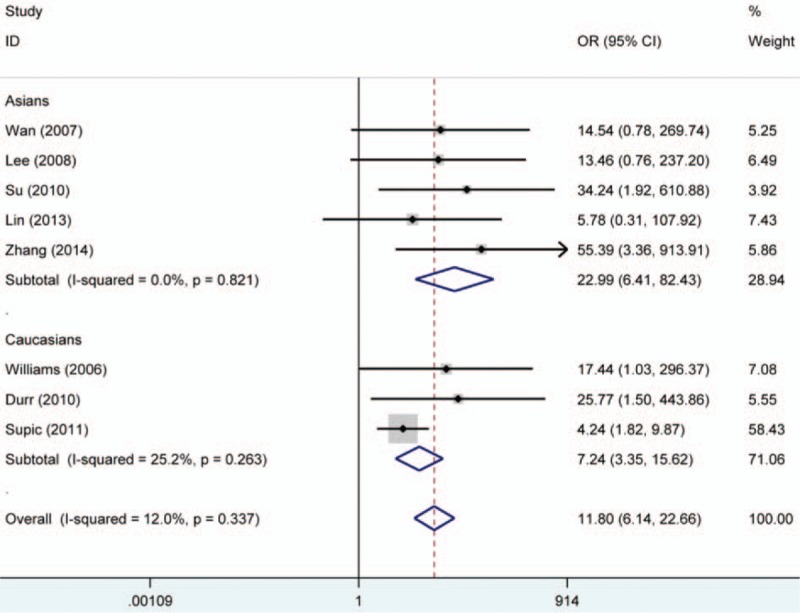
Forest plot on association between RASSF1A promoter hypermethylation and oral cancer risk. The forest plot is drawn to calculate a pooled estimated value of ORs and 95%CIs with stata 12.0 software. For each study, the estimation of ORs and its 95% CI are plotted with a box and a horizontal line which cross the imaginary line. The length of the black line which crosses the imaginary line is proportional to the 95%CIs of included studies. The weight represents the number of elements that give rise to the overall value. According to the chi-squared test based on Q-statistic test, the value of I-squared and P value were used to evaluate the heterogeneity among studies. And no heterogeneity is found in the forest plot. The results indicated that people with RASSF1A promoter hypermethylation were 11.8 times higher risk than those without RASSF1A promoter hypermethylation to suffer from oral cancer. In addition, subgroup analysis based ethnicity was performed. ORs = odds ratios, RASSF1A = RAS association domain family protein 1a.